Average winner and average loser
Your average winner is the mean profit on your winning trades, and your average loser is the mean loss on the losing ones. With win rate, they decide if you make money.
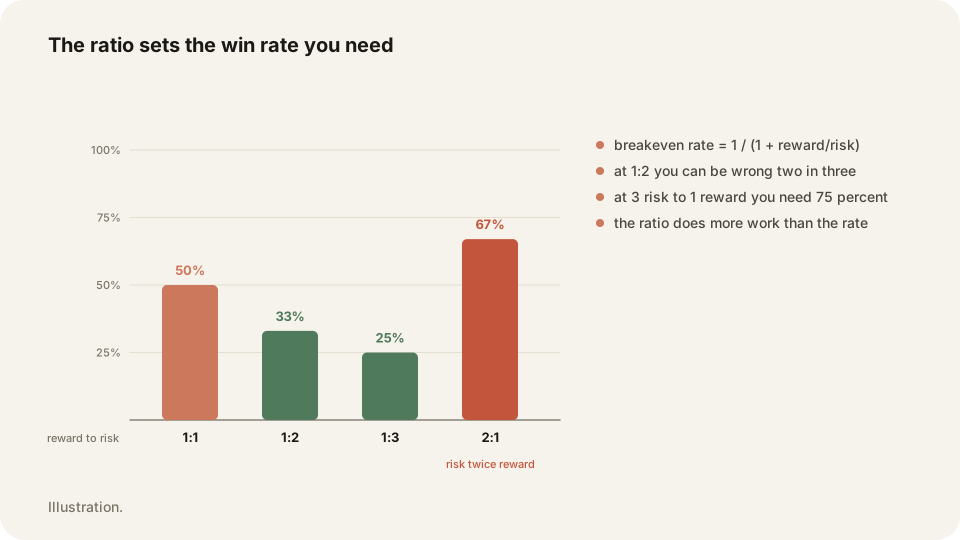
In depth
The arithmetic fits on one line. Multiply your win rate by the average winner, then subtract the loss rate times the average loser. That gives you the average dollars a trade puts in your account, which is your expectancy.
Try it. Win 50 percent, average winner 400, average loser 200: half of 400 is 200, half of 200 is 100, so each trade is worth 100 dollars. Now keep the same 50 percent but let the average loser drift to 450. Half of 400 is 200, half of 450 is 225, and every trade costs you 25 dollars. Nothing about the win rate changed.
Why it matters
These two numbers are the ones you can act on. You cannot make the market give you more winners, but you can cut a loser sooner and stop taking profit at the first green tick. A win rate that was not enough on Monday becomes enough by Friday if the average loser comes down.
TraderLog shows average winner and average loser on the stats page next to win rate, profit factor and expectancy, all worked out from imported fills. An automatic gave back tag flags the winners you let turn around, which is where the average winner leaks.
Frequently asked questions
It depends on your win rate. At 50 percent you need winners bigger than losers just to break even.
Cut at your stop instead of hoping. One trade held too long can move the average for a month.
Keep your Average winner and average loser trades on the record in TraderLog
Trades import from Schwab and IBKR on their own, every day lands on a calendar with its P&L, and the day's entry sits beside it. Replay any trade on a TradingView chart. Free for 14 days, no card.
Every trading morning at 8:40 ET our model draws the SPY, QQQ and IWM zones it expects to matter, on a TradingView chart, before the open. Where price reaches one, it has turned 74 percent of the time. Free, no account. See today's map