Bullish engulfing
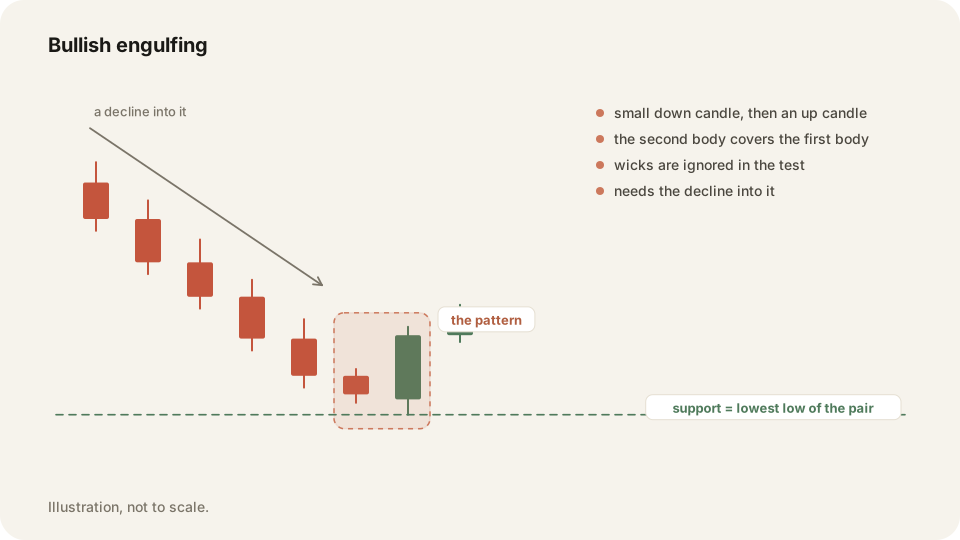
A bullish engulfing is a small down candle followed by an up candle whose body covers it. It forms after a fall, and the pair's lowest low marks support.
In depth
Compare bodies, not wicks. The second candle's body has to cover the first candle's body from open to close. The colour flips from down to up. Without a decline in front of it there is nothing to reverse, so the shape does not count.
The useful part is the price, not the name. Support goes at the lowest low of the two candles, say 99.50. Your stop sits under that low. It triggers on a candle closing below it, not on a wick through it. Buy at 99.80 with the stop at 99.40 and you risk 40 cents.
Why it matters
The pattern marks a level, it does not shout buy. Traders enter on the big up candle itself, far above the low. The stop is then so far away that the trade cannot pay twice the risk. The move is to wait for price to ease back toward the low.
Tag your engulfing entries. The By tag table shows what they returned next to everything else. Trade replay puts your fills on a TradingView chart. You can see how far above the low you got in.
Frequently asked questions
No. The test uses bodies only. Wicks matter afterwards, because support goes at the lowest low of the pair.
Not as a reversal. With no decline into it, read the pair as continuation and keep the low as support.
Keep your Bullish engulfing trades on the record in TraderLog
Trades import from Schwab and IBKR on their own, every day lands on a calendar with its P&L, and the day's entry sits beside it. Replay any trade on a TradingView chart. Free for 14 days, no card.
Every trading morning at 8:40 ET our model draws the SPY, QQQ and IWM zones it expects to matter, on a TradingView chart, before the open. Where price reaches one, it has turned 74 percent of the time. Free, no account. See today's map