Wick (shadow)
A wick is the thin line above or below a candle's body. It shows where price went during that period before it was pushed back.
In depth
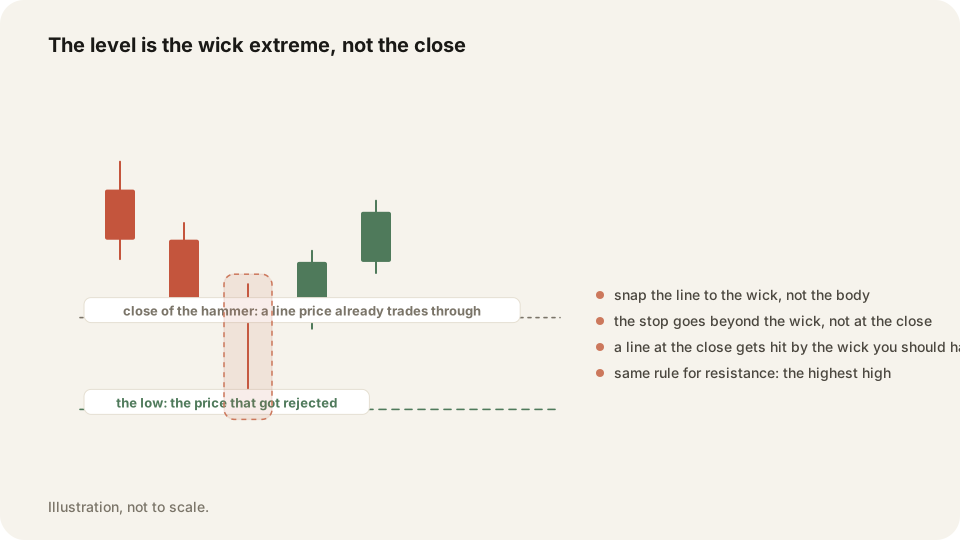
The body covers the open and the close. The wick is everything beyond it, so it is the part of the move that did not stick. A long upper wick means sellers took price back down. A long lower wick means buyers stepped in.
Say a candle opens at 100, runs to 101, then closes at 100.10. The body is ten cents and the upper wick is ninety. Those extremes are where your lines belong. Draw support at the low of the wick, not at the body. That is the furthest price actually traded.
Why it matters
Two habits follow from this. Draw levels from wick extremes, so your lines do not cut through candles. Then judge a stop on the close, not on a wick through your level. Price often pokes past a level and comes back, and exiting on that poke ends trades that worked.
Trade replay puts your fills on a TradingView chart. Go back and see whether the candle closed past your level or only wicked through it. The free Morning Map draws the zones on SPY, QQQ and IWM before the open.
Frequently asked questions
Nothing. They are two words for the same part of the candle, the thin line beyond the body.
From the wick extremes. That is the furthest price traded, and a line there does not cut through the candle.
Keep your Wick (shadow) trades on the record in TraderLog
Trades import from Schwab and IBKR on their own, every day lands on a calendar with its P&L, and the day's entry sits beside it. Replay any trade on a TradingView chart. Free for 14 days, no card.
Every trading morning at 8:40 ET our model draws the SPY, QQQ and IWM zones it expects to matter, on a TradingView chart, before the open. Where price reaches one, it has turned 74 percent of the time. Free, no account. See today's map