Candlestick pattern
A candlestick pattern is a shape made by one to three candles that marks a place where price turned. It hands you a level rather than a prediction.
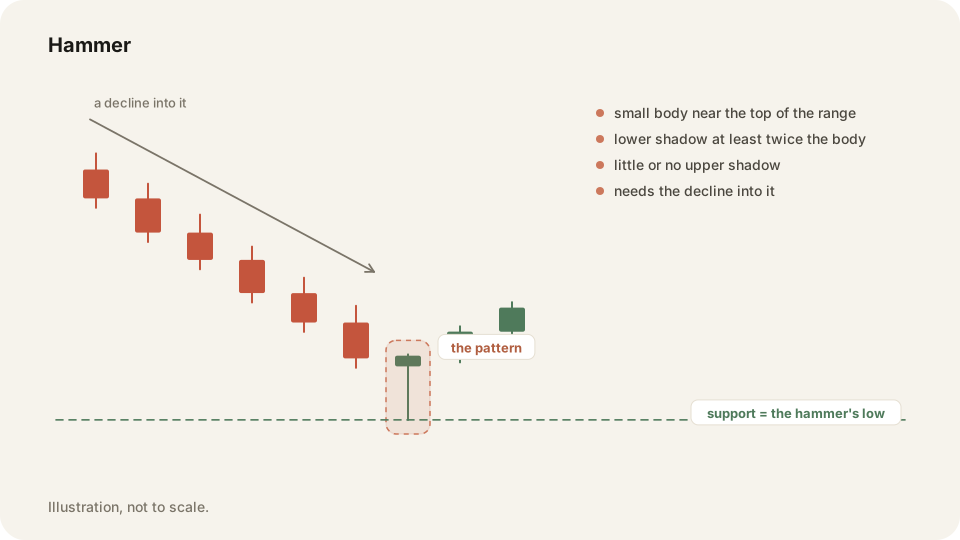
In depth
A short list does the work. Hammer and shooting star come from one candle. Bullish and bearish engulfing, piercing line and dark cloud cover come from two. Morning star and evening star come from three. Rising and falling windows are gaps. Five bullish shapes and five bearish mirrors.
Each one needs the move that came before it. A hammer after a fall is a hammer. The same shape after a run higher is a hanging man and says something else. The useful output is the extreme: the lowest low for support, the highest high for resistance, never a body or a close.
Why it matters
A pattern does not tell you to buy. It marks a price that mattered, so you know where the idea is wrong. Traders who take the shape on its own get stopped out in open space, because a shape with no level behind it marks nothing you can defend.
Tag each trade with the pattern you traded and the By tag table ranks them by win rate and average result. After 30 or 40 trades you will know which two shapes pay you and which ones you should stop taking.
Frequently asked questions
About ten covers it: five bullish shapes and their five bearish mirrors. Learning more rarely adds anything useful.
As a way to mark levels, yes. As a buy signal on their own, they land close to a coin flip.
Keep your Candlestick pattern trades on the record in TraderLog
Trades import from Schwab and IBKR on their own, every day lands on a calendar with its P&L, and the day's entry sits beside it. Replay any trade on a TradingView chart. Free for 14 days, no card.
Every trading morning at 8:40 ET our model draws the SPY, QQQ and IWM zones it expects to matter, on a TradingView chart, before the open. Where price reaches one, it has turned 74 percent of the time. Free, no account. See today's map