Doji
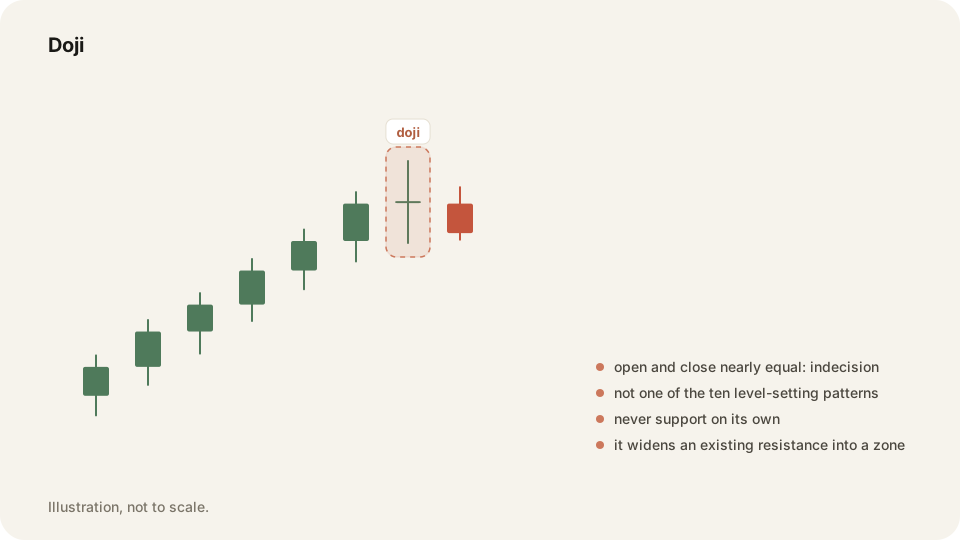
A doji is a candle that opens and closes at almost the same price. Neither side won that period, so it marks a pause rather than a signal to trade.
In depth
The body is a line. Open and close finish within a few cents of each other, so the colour tells you nothing. The wicks can be long or short. Where it prints decides whether it matters: a doji on the daily chart covers a whole session, while a one-minute chart in a quiet stock prints them all morning.
Its narrow use is widening a level. A doji at a resistance line at 100 with a high of 100.40 turns that line into a band from 100 to 100.40. You take nothing inside the band, so your entry moves outside it and your stop sits beyond the chop. A doji does not set a level of its own, and one printing against you is not a reason to exit.
Why it matters
Two mistakes go away. The first is closing a good trade because one small candle printed against you. A trend that pauses for a candle is ordinary. The second is treating a doji as support and buying it, which parks your stop under a candle that showed no buyers at all.
A doji is usually a reason to sit still, and TraderLog shows what sitting still is worth. The calendar puts every day's profit or loss in one grid, and the stats page compares results after a win against results after a loss, where itchy days show up.
Frequently asked questions
Neither. It shows indecision, and its meaning depends on the level it prints at.
No. Use it to widen a level you already drew, then wait for price to clear that band.
Keep your Doji trades on the record in TraderLog
Trades import from Schwab and IBKR on their own, every day lands on a calendar with its P&L, and the day's entry sits beside it. Replay any trade on a TradingView chart. Free for 14 days, no card.
Every trading morning at 8:40 ET our model draws the SPY, QQQ and IWM zones it expects to matter, on a TradingView chart, before the open. Where price reaches one, it has turned 74 percent of the time. Free, no account. See today's map