Fakeout
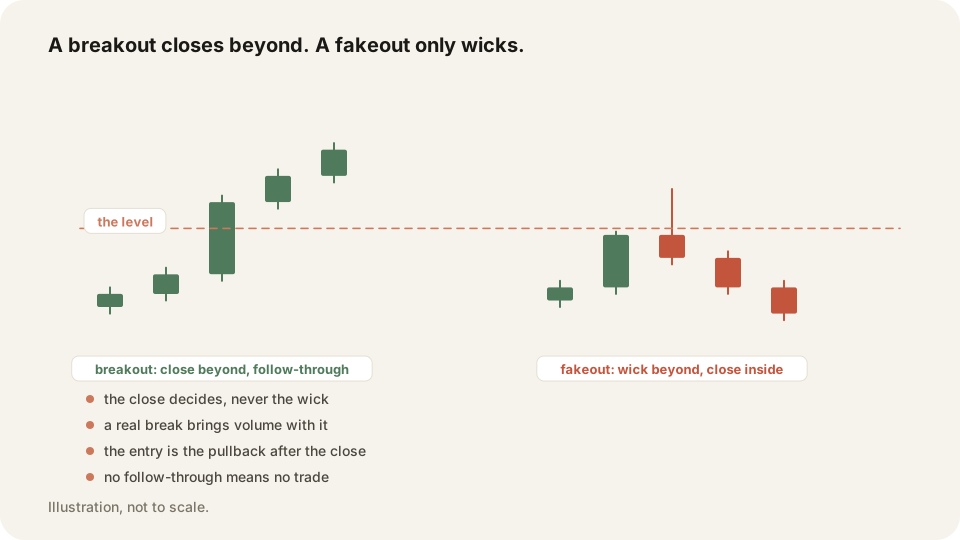
A fakeout is a push through support or resistance that never closes beyond it and snaps back. The traders who entered on the break are left stranded.
In depth
Resistance sits at 100. Price pokes to 100.35 and buyers take the break. The candle closes at 99.70, and the next one takes out their entries. Those buyers were the fill that sellers waiting at 100 needed. Getting back out pushes price lower still.
This is normal, not rare. A large move needs orders, and the orders sit just beyond the level everyone can see. So expect the misleading push at the level you like best. Before calling a break real, ask three things. Did a candle close beyond the level on your timeframe? Did volume come with it? Did price return to the level and hold?
Why it matters
Fakeouts are why entering on the break candle is expensive. You can be right about direction and still lose. Your fill sits far from your stop, so the geometry never pays two to one. Waiting for the pullback puts you near the level, with a small stop and the same target.
Whether it was a fakeout is a question about the close, and the chart answers it. Open the trade in TraderLog and your fills appear on a TradingView chart. You can see whether a candle closed beyond the level or a wick came back.
Frequently asked questions
A push beyond a level that never closes beyond it and reverses. The traders who bought the break become fuel for the move against them.
Wait for a close beyond the level on your own timeframe. Then enter on the pullback rather than the break candle.
Keep your Fakeout trades on the record in TraderLog
Trades import from Schwab and IBKR on their own, every day lands on a calendar with its P&L, and the day's entry sits beside it. Replay any trade on a TradingView chart. Free for 14 days, no card.
Every trading morning at 8:40 ET our model draws the SPY, QQQ and IWM zones it expects to matter, on a TradingView chart, before the open. Where price reaches one, it has turned 74 percent of the time. Free, no account. See today's map