Falling window
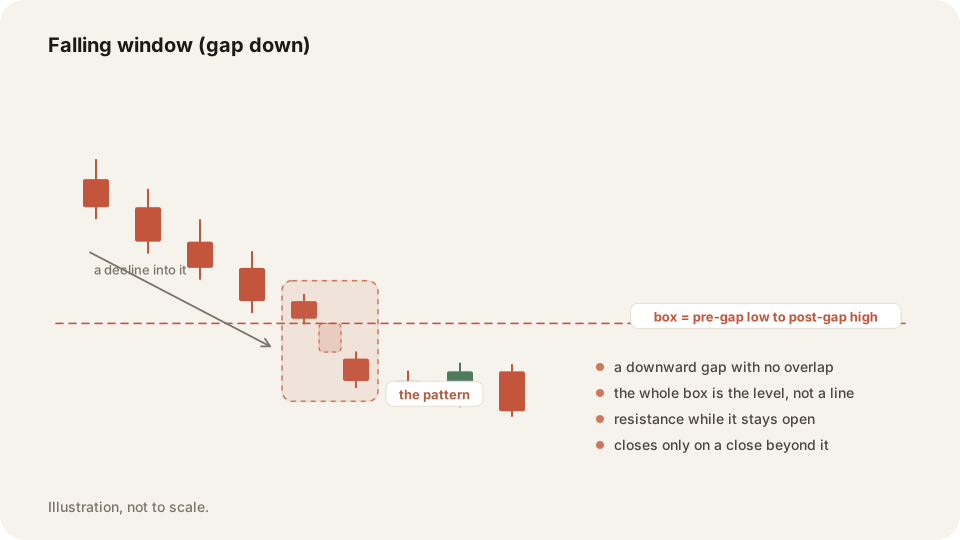
A falling window is a downward gap with no overlap. The second candle's high sits below the first candle's low, and the space acts as resistance.
In depth
Window is the candlestick name for a gap. Draw it as a box, from the first candle's low down to the second candle's high. Then extend it to the right. The whole box is resistance while it stays open, and the far edge is the strongest part.
Say the first candle's low is 101.40 and the next candle's high is 100.20. Everything between is the window. A rally into 100.20 is arriving at the near edge, not breaking out. The window closes when a candle closes above the box. That area often works as support afterwards.
Why it matters
Traders shrink a gap to a single line and then get stopped by the rest of the box. Keep the whole rectangle instead. It shows where to stay out, and where a rejection has the most behind it. The exit trigger is a close above the box, never a wick.
Trade replay puts your fills on a TradingView chart. You can check where the gap sat when you entered. The free Morning Map draws zones on SPY, QQQ and IWM before the open. The levels are ready before you trade.
Frequently asked questions
Only the word. Window is the candlestick name. What changes is the drawing: keep the whole rectangle, not one line.
When a candle closes above the box on that timeframe or a higher one. A wick through it does not count.
Keep your Falling window trades on the record in TraderLog
Trades import from Schwab and IBKR on their own, every day lands on a calendar with its P&L, and the day's entry sits beside it. Replay any trade on a TradingView chart. Free for 14 days, no card.
Every trading morning at 8:40 ET our model draws the SPY, QQQ and IWM zones it expects to matter, on a TradingView chart, before the open. Where price reaches one, it has turned 74 percent of the time. Free, no account. See today's map