Gap fill
A gap fill is price trading back through a gap left on the chart. The gap is a range where nothing traded, so it often draws price back to it later.
In depth
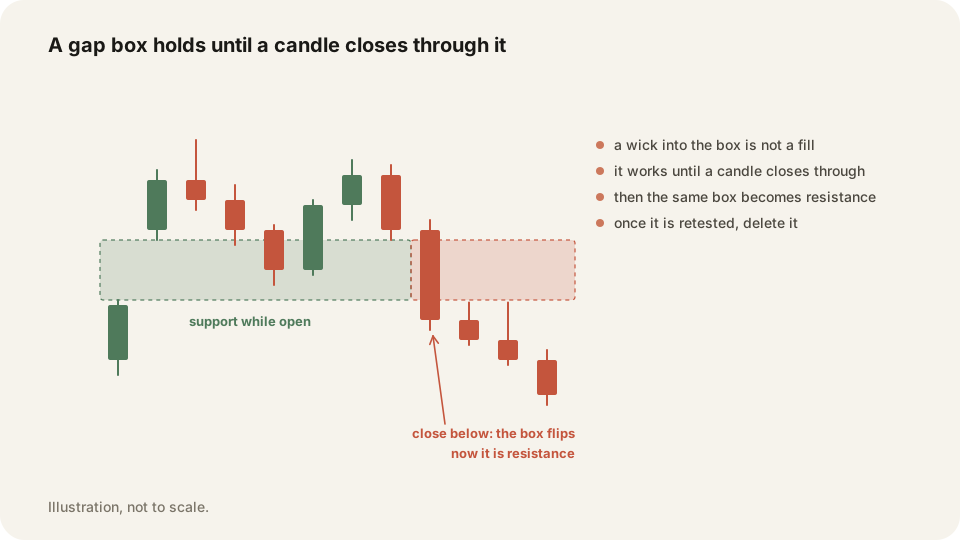
A stock closes at 100 and opens at 103. That 100 to 103 range is empty, because no buying or selling happened in there. Draw it as a box rather than a line. While the box holds, price coming back down into it is the fill, and the far edge is the part that matters most.
Poking into the box is not the same as closing it. A window closes only when a candle closes beyond the whole box, on the gap's own timeframe or higher, and you never shrink the box to make it fit. Once it closes, the box flips role: old support becomes resistance.
Why it matters
Traders treat a gap fill as certain and short every gap up on that logic. Some gaps never fill, and the ones that do can take weeks. Treating a wick into the box as a closed gap is worse. You take the exit early, then watch the level do exactly what it was drawn to do.
The free Morning Map draws SPY, QQQ and IWM zones before the open, gaps included. Tag your gap trades and the By tag table compares them with your other setups, and trade replay shows your fills on a TradingView chart next to the box.
Frequently asked questions
No. Many do eventually, some never do, and the wait can run into weeks. It is a tendency, not a rule.
When a candle closes beyond the whole gap box, on the gap's own timeframe or higher. A wick through it does not count.
Keep your Gap fill trades on the record in TraderLog
Trades import from Schwab and IBKR on their own, every day lands on a calendar with its P&L, and the day's entry sits beside it. Replay any trade on a TradingView chart. Free for 14 days, no card.
Every trading morning at 8:40 ET our model draws the SPY, QQQ and IWM zones it expects to matter, on a TradingView chart, before the open. Where price reaches one, it has turned 74 percent of the time. Free, no account. See today's map