Gap up
A gap up is when a stock opens above the previous session's high, leaving a space on the chart where nothing traded.
In depth
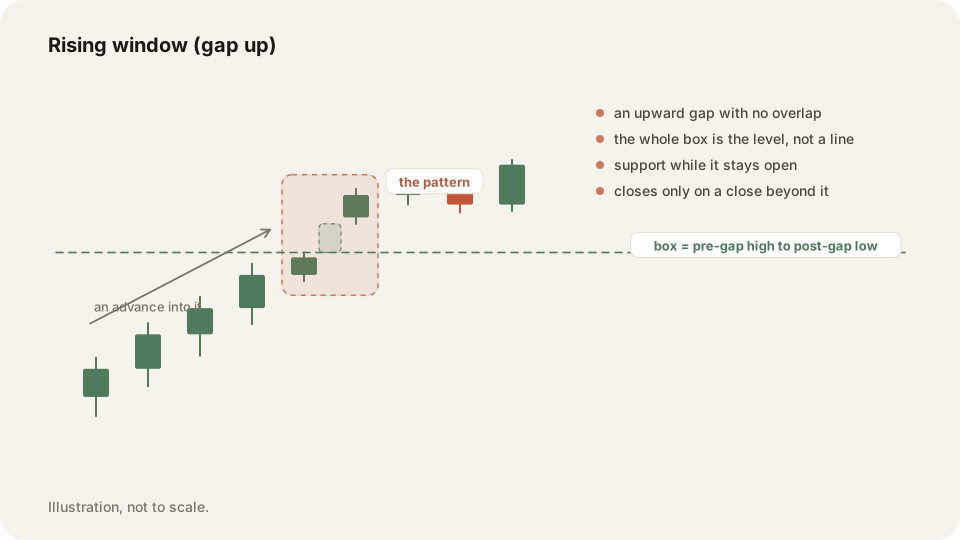
Yesterday's high was 100 and today opens at 103. Nothing changed hands between those prices, so the chart shows a blank box from 100 to 103. Gaps come from news, earnings or overnight moves in the wider market, all of which happen while the regular session is shut.
While the space stays open, treat the whole box as support rather than a single line, with the far edge at 100 as the strongest part of it. The box stops being support when a candle closes below it on the timeframe the gap appeared on. After that close it reads as resistance instead.
Why it matters
Traders draw one line at the opening price and get chopped up inside the gap. The space is a zone, and prices inside it have no history behind them, so there is little to lean on. Knowing where the box ends tells you where your stop has something to stand on.
The free Morning Map draws the zones on SPY, QQQ and IWM before the open, so you can see the gap before you trade it. Afterwards, tag your gap trades and the By tag table shows whether they pay you or cost you.
Frequently asked questions
Yes. Rising window is the candlestick name, and it treats the whole gap as a box rather than one line.
No. Many do eventually, but there is no rule about when, and betting on it has emptied plenty of accounts.
Keep your Gap up trades on the record in TraderLog
Trades import from Schwab and IBKR on their own, every day lands on a calendar with its P&L, and the day's entry sits beside it. Replay any trade on a TradingView chart. Free for 14 days, no card.
Every trading morning at 8:40 ET our model draws the SPY, QQQ and IWM zones it expects to matter, on a TradingView chart, before the open. Where price reaches one, it has turned 74 percent of the time. Free, no account. See today's map