Hammer
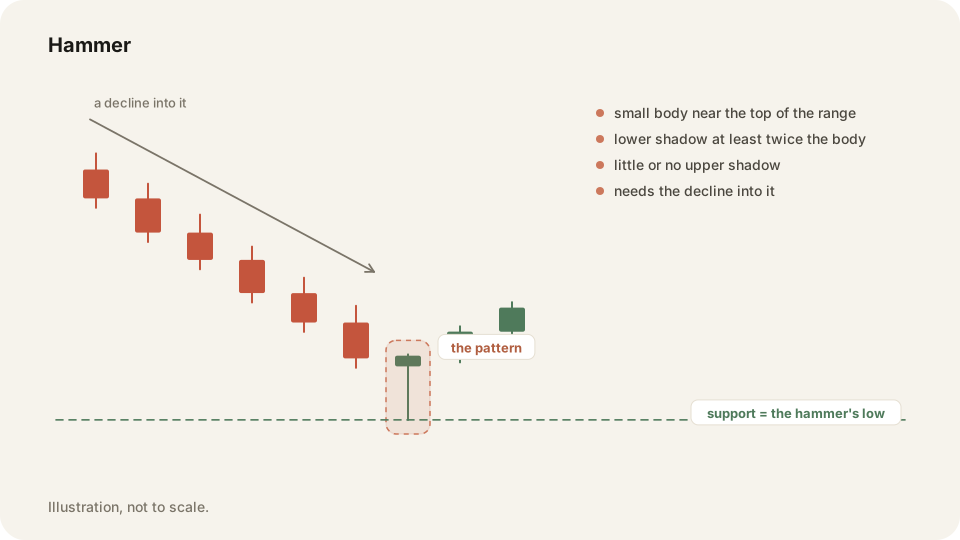
A hammer is a single candle that forms after a fall, with a small body and a long lower wick. Its low marks a support level.
In depth
Three things to check. The body is small and sits near the top of the candle's range. The lower wick runs at least twice the length of that body. The upper wick is tiny or missing. Colour does not matter, so a red hammer counts the same as a green one.
The shape means nothing without a fall in front of it. A hammer is sellers pushing price down and then losing control of it, so price has to have been dropping into that candle. The same shape after a run higher is a hanging man and reads the other way round.
Why it matters
The candle hands you a price you can defend. The stop goes beyond the low, and it should trigger on a candle closing past it rather than a wick through it. Wicks under obvious prices are often resting orders being cleared, a move that takes you out then leaves.
Tag your hammer entries and the By tag table shows how that setup pays compared with the rest of your trading. Replay the trade on a TradingView chart with your fills marked, so you can see whether you entered near the low or chased it.
Frequently asked questions
No. Colour plays no part in the test. Only the small body and the long lower wick matter.
Same shape. A hammer forms after a fall, a hanging man after a rise, so they point opposite ways.
Keep your Hammer trades on the record in TraderLog
Trades import from Schwab and IBKR on their own, every day lands on a calendar with its P&L, and the day's entry sits beside it. Replay any trade on a TradingView chart. Free for 14 days, no card.
Every trading morning at 8:40 ET our model draws the SPY, QQQ and IWM zones it expects to matter, on a TradingView chart, before the open. Where price reaches one, it has turned 74 percent of the time. Free, no account. See today's map