Higher timeframe bias
Higher timeframe bias is the direction you read from a chart well above the one you enter on. It is up, down or sideways, and its job is to veto trades against it.
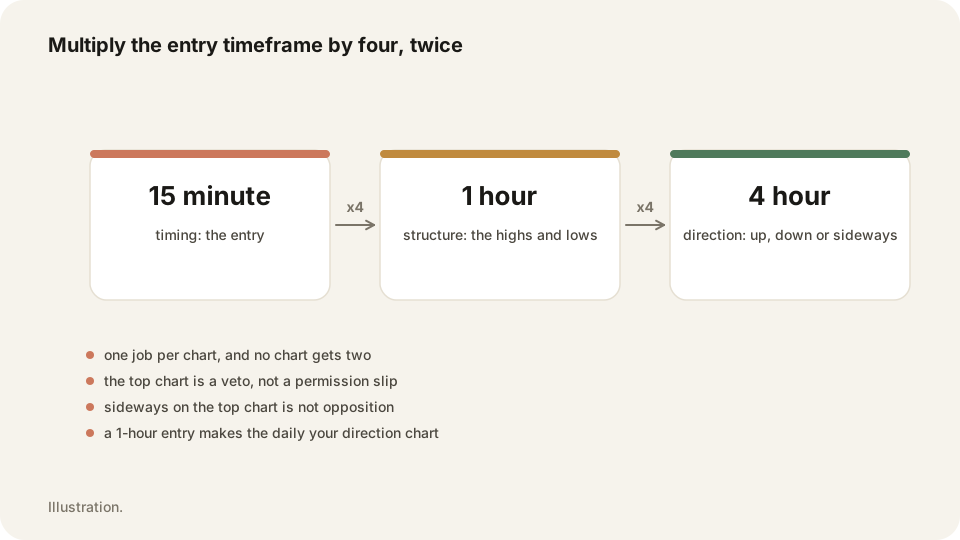
In depth
Pick the chart by multiplying, not by opening more windows. Take the timeframe you enter on, multiply by four for structure, and by four again for direction. A fifteen-minute entry uses the hourly for structure and the four-hour for direction. Three charts, each with one job.
Trouble starts when the gap between two charts is too wide. Enter on the one-minute against an hourly bias and an ordinary hourly pullback looks like a reversal, so you get shaken out of a trade you called correctly. Sideways is best read as the absence of a direction rather than opposition to yours. How flat counts as sideways is a judgment call.
Why it matters
The bias is the cheapest filter you own. One glance removes a whole set of trades that were losing before you clicked. It also explains a specific frustration: the setup looked perfect and the stop still got hit, and the pullback that hit it was visible on the chart you skipped.
Write the bias in the TraderLog daily entry in three words before the open, then read it back against the P&L calendar. The stats page splits long results from short results, which is where trading against your own bias shows up as a number.
Frequently asked questions
Multiply your entry timeframe by four twice, so a fifteen-minute entry reads the hourly for structure and the four-hour for direction.
Only at a strong level, on purpose and with smaller size. Never because a shape appeared in open space.
Keep your Higher timeframe bias trades on the record in TraderLog
Trades import from Schwab and IBKR on their own, every day lands on a calendar with its P&L, and the day's entry sits beside it. Replay any trade on a TradingView chart. Free for 14 days, no card.
Every trading morning at 8:40 ET our model draws the SPY, QQQ and IWM zones it expects to matter, on a TradingView chart, before the open. Where price reaches one, it has turned 74 percent of the time. Free, no account. See today's map