Latest entry price
The latest entry price is the highest price you can still pay and have the trade pay you at least twice what you risk. Past it, the setup has expired.
In depth
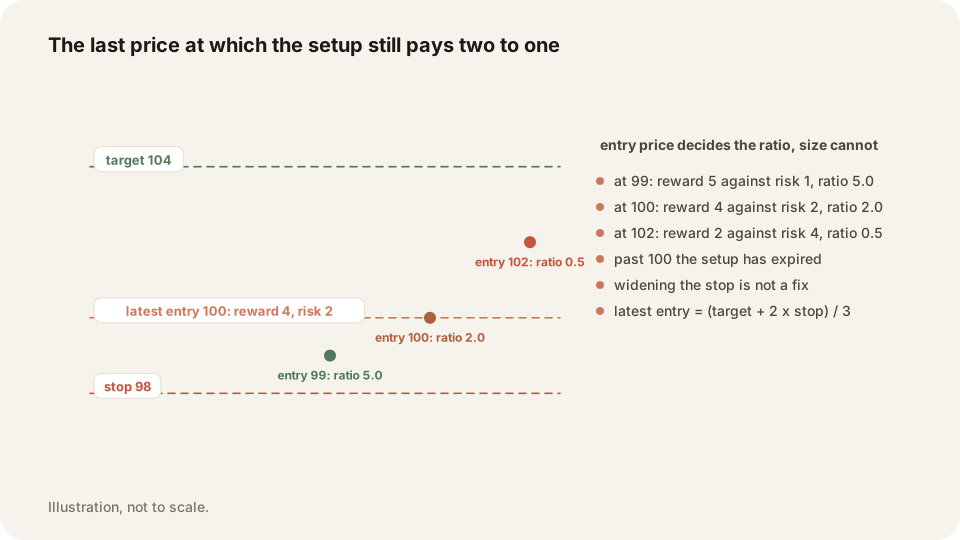
Your stop and target are fixed by the chart, not by your entry. Support sits at 100, so the stop is a close below it. The next resistance is 104, so that is the target. Now the only variable is where you get in, and it decides the ratio.
Enter at 100.50 and you risk about 0.50 to make 3.50, which is seven to one. Enter at 101.33 and you risk 1.33 to make 2.67, which is exactly two to one. That price is your latest entry. Draw it as a line on the chart. Above it the trade no longer pays enough, and widening the stop is not a fix, because the stop is a place on the chart.
Why it matters
Most of the damage from chasing shows up here. The setup was fine an hour ago, and by the time you clicked the price had moved past the point where the maths worked. You can be right about direction and still take a losing trade. Drawing the line in advance turns that into a yes or no you can check in a second.
The free risk to reward calculator does the arithmetic before you enter. Afterwards, tag the trades you chased and the By tag table shows what those entries paid against the ones you took at the level.
Frequently asked questions
Skip the trade. Wait for a pullback to the level, or find another setup.
No. The stop is a price on the chart, so moving it means the idea is no longer defined.
Keep your Latest entry price trades on the record in TraderLog
Trades import from Schwab and IBKR on their own, every day lands on a calendar with its P&L, and the day's entry sits beside it. Replay any trade on a TradingView chart. Free for 14 days, no card.
Every trading morning at 8:40 ET our model draws the SPY, QQQ and IWM zones it expects to matter, on a TradingView chart, before the open. Where price reaches one, it has turned 74 percent of the time. Free, no account. See today's map