Manipulation phase
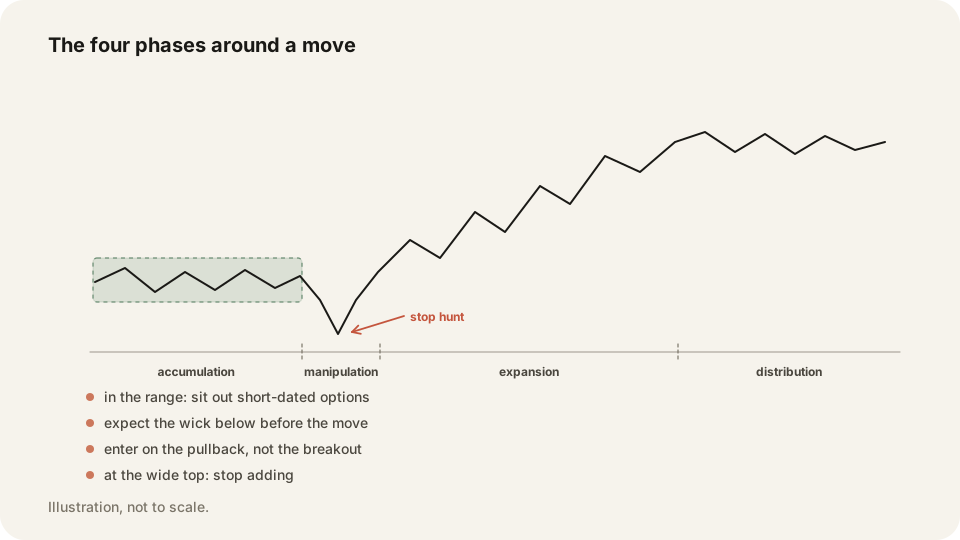
The manipulation phase is the misleading move around a level that pushes traders out just before the real move begins. It is the stop hunt.
In depth
A big move needs someone on the other side of it. If everyone who wants to buy has already bought, there is nobody left to sell to. So price dips below an obvious support first, takes out the stops resting there, collects that supply, and then goes up. It works the same way upside down.
Your chart shows it as a wick through the level that never closes beyond it. Support sits at 100, price drops to 99.60, buyers appear, and the candle closes at 100.40. Nothing broke. The traders who used 99.90 as a stop are gone anyway.
Why it matters
This is why an exit on a wick is expensive and an exit on a close is not. Put your stop where the idea is genuinely wrong, a little beyond the level rather than right under it, and let a candle close decide. Otherwise you are funding the move you wanted.
Trade replay on a TradingView chart shows your exit against the candle that took you out, so you can count how often a wick did it. The stats page compares your average loser with your average winner over the same period.
Frequently asked questions
The stops are real and so is the liquidity they hand over. Whether anyone aims at them on purpose is unprovable.
Place stops beyond the level rather than on the obvious round number, and exit on a candle close, not a wick.
Keep your Manipulation phase trades on the record in TraderLog
Trades import from Schwab and IBKR on their own, every day lands on a calendar with its P&L, and the day's entry sits beside it. Replay any trade on a TradingView chart. Free for 14 days, no card.
Every trading morning at 8:40 ET our model draws the SPY, QQQ and IWM zones it expects to matter, on a TradingView chart, before the open. Where price reaches one, it has turned 74 percent of the time. Free, no account. See today's map