Multi-timeframe analysis
Multi-timeframe analysis means reading the same stock on three charts. A high one for direction, a middle one for structure, and your entry chart for timing.
In depth
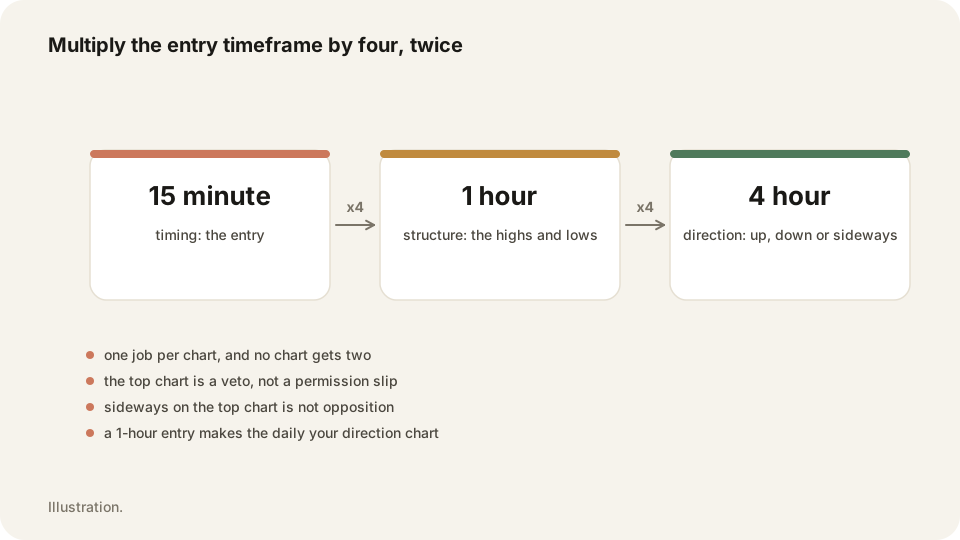
Start from the chart you enter on, then multiply. Multiply by four for the middle chart and by four again for the top one. A five minute entry gives you a fifteen minute structure chart and an hourly for direction.
Each chart has one job. The top chart answers up, down or sideways and nothing else. The middle chart shows the highs and lows you trade around. The entry chart only tells you when. Three is enough. Add more and you will always find one that agrees with you.
Why it matters
Trading a one minute chart against an hourly trend is how ordinary pullbacks come to look like reversals. You end up short into strength. Or shaken out of a good trade by a dip the higher chart cannot see. If the charts disagree, the honest answer is no trade.
Trade replay puts your fills on a TradingView chart. Switch timeframes there and see what the higher chart was doing. Tag the trades you took against the higher trend. The By tag table shows what they cost.
Frequently asked questions
Three. Direction, structure and timing. A fourth chart tends to add an opinion rather than information.
Stand down, or at least trade smaller. The main rule is not to trade against the highest chart.
Keep your Multi-timeframe analysis trades on the record in TraderLog
Trades import from Schwab and IBKR on their own, every day lands on a calendar with its P&L, and the day's entry sits beside it. Replay any trade on a TradingView chart. Free for 14 days, no card.
Every trading morning at 8:40 ET our model draws the SPY, QQQ and IWM zones it expects to matter, on a TradingView chart, before the open. Where price reaches one, it has turned 74 percent of the time. Free, no account. See today's map