Piercing line
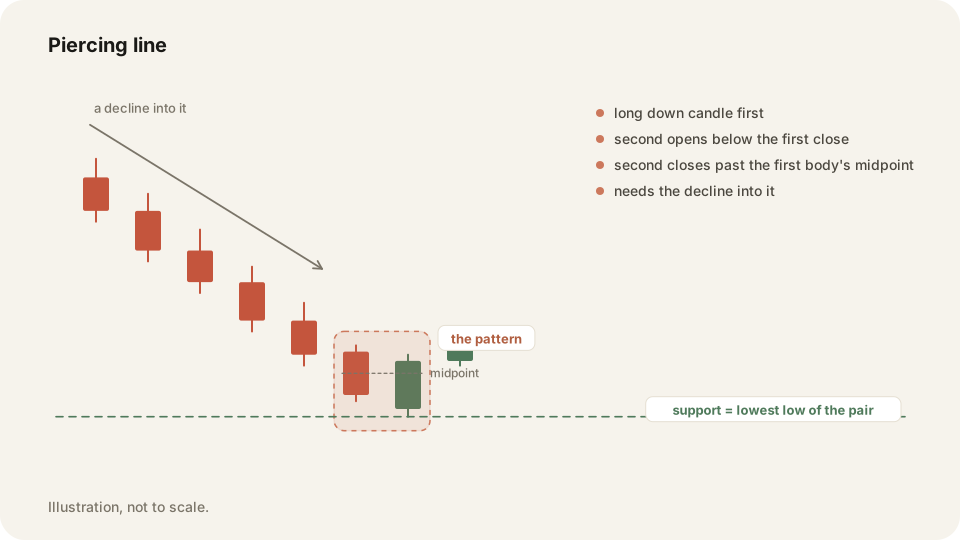
A piercing line is a down candle followed by an up candle that closes past the midpoint of the first candle's body. It marks support at the pair's lowest low.
In depth
Two conditions and one measurement. The first candle is a down candle inside a fall. The second opens below the first candle's close, then closes above the midpoint of the first body. If the first opens at 102 and closes at 98, the midpoint is 100. The second has to open under 98 and close above 100, so a close at 99.80 fails.
That midpoint test is the only difference from a bullish engulfing, which asks the second body to cover the first one completely. The level is the lowest low of the two candles, say 97.60, and that is where your stop belongs.
Why it matters
A pass or fail you can measure keeps the chart honest. Nearly pierced is a fail. Without that hard edge you end up with a line at every second candle, and a chart covered in levels is a chart with none you trust.
Tag the trades you took from a piercing line and the By tag table puts that setup's win rate and average result next to everything else. Trade replay on a TradingView chart shows where your entry sat against the level.
Frequently asked questions
A two candle bullish reversal where the second opens below the first close and shuts above the middle of its body.
Call it a fail. The test is a close past the midpoint, and a borderline candle is not worth your money.
Keep your Piercing line trades on the record in TraderLog
Trades import from Schwab and IBKR on their own, every day lands on a calendar with its P&L, and the day's entry sits beside it. Replay any trade on a TradingView chart. Free for 14 days, no card.
Every trading morning at 8:40 ET our model draws the SPY, QQQ and IWM zones it expects to matter, on a TradingView chart, before the open. Where price reaches one, it has turned 74 percent of the time. Free, no account. See today's map