Pullback
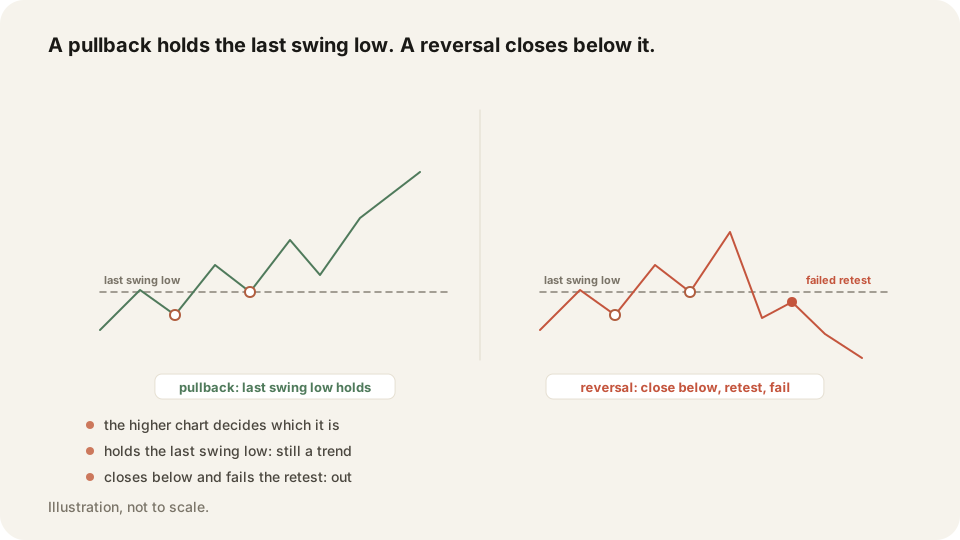
A pullback is a short move against the trend that then holds. In an uptrend, price dips and stops above the last low before carrying on.
In depth
The test is where the dip stops. In an uptrend a pullback holds above the previous low and the trend is intact. A candle closing below that low is no longer a pullback, it is a possible change of trend.
Price runs from 100 to 103, then eases back to 101.20, with the last low at 100.80. That dip is the buying area, not a reason to sell. It is also where the arithmetic works. Buy at 101.20 with a stop at 100.60 and you risk 60 cents. Buy the high at 103 and the same stop costs 2.40.
Why it matters
Reading a pullback as a reversal is a common and expensive mistake. You exit a good trade, or you short into a trend that has not changed. Entry distance is the other half. Chasing the move instead of waiting for the dip leaves your stop too far away to pay.
Trade replay puts your fills on a TradingView chart. You can see whether you bought the dip or the high of the move. Tag both kinds of entry, and the By tag table shows which one pays you.
Frequently asked questions
As deep as the last swing low. A close below that puts the trend in question rather than just resting.
By the higher timeframe and by that last low. Until it breaks on a close, the trend is still the trend.
Keep your Pullback trades on the record in TraderLog
Trades import from Schwab and IBKR on their own, every day lands on a calendar with its P&L, and the day's entry sits beside it. Replay any trade on a TradingView chart. Free for 14 days, no card.
Every trading morning at 8:40 ET our model draws the SPY, QQQ and IWM zones it expects to matter, on a TradingView chart, before the open. Where price reaches one, it has turned 74 percent of the time. Free, no account. See today's map