Resistance
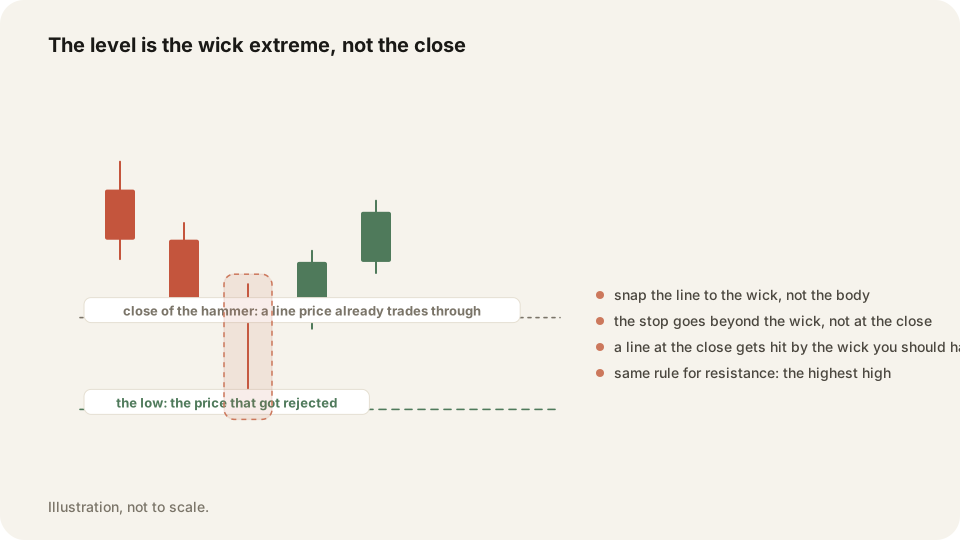
Resistance is a price where sellers stepped in before and stopped a rise. It is drawn at the high of the candle pattern that turned price back, not at a body or a close.
In depth
Think of a ceiling in a low room. Price rises, meets the same area, and comes back down. Draw the line at the extreme of the shape that rejected price, so the highest high of that pattern. Lines should not cut through candles, which is why you snap to the wick.
Resistance works both ways. While price sits under it, it is a place to sell into. Once price closes above it and holds, the same line becomes support and it is a place to buy from. What counts is a close beyond it, not a wick poking through it.
Why it matters
Marking too many levels is as bad as marking none. Three resistances above and three supports below, across all your timeframes together, is enough to trade from. Levels drawn off a year of history sit where everyone can see them, which is exactly where crowded stops get taken out.
Tag the trades you took at a level and the By tag table shows how that group did against the rest. The free Morning Map marks SPY, QQQ and IWM zones before the open, and trade replay puts your fills on a TradingView chart beside your own lines.
Frequently asked questions
At the highest high of the pattern that turned price back. Snap the line to the wick so it does not cut candles.
Either. When two or more levels sit close together, merge them into one zone and delete the lines inside it.
Keep your Resistance trades on the record in TraderLog
Trades import from Schwab and IBKR on their own, every day lands on a calendar with its P&L, and the day's entry sits beside it. Replay any trade on a TradingView chart. Free for 14 days, no card.
Every trading morning at 8:40 ET our model draws the SPY, QQQ and IWM zones it expects to matter, on a TradingView chart, before the open. Where price reaches one, it has turned 74 percent of the time. Free, no account. See today's map