Reversal
A reversal is a trend changing direction rather than pausing. Price closes beyond the last swing point and comes back to test it. Then it keeps going the new way.
In depth
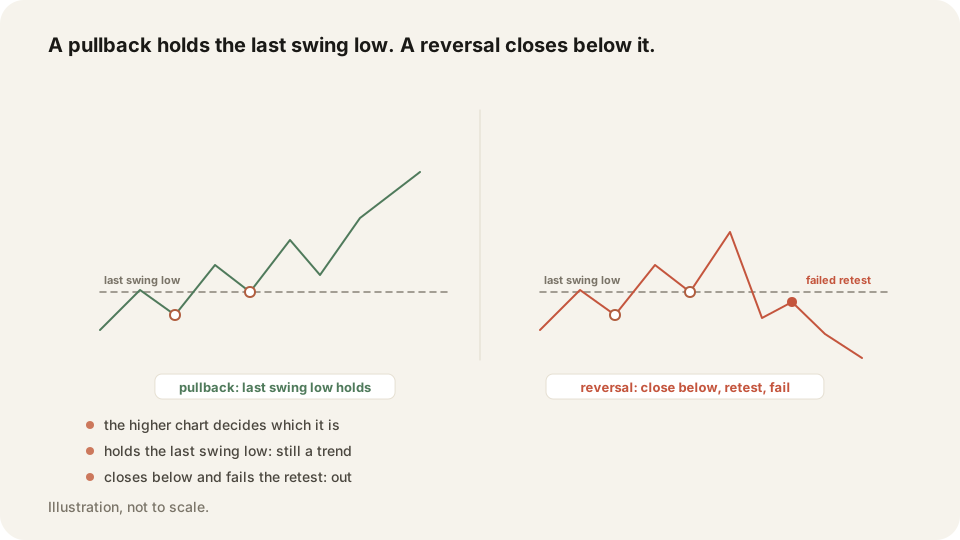
An uptrend makes higher highs and higher lows. A reversal starts when price closes below the last higher low, on the timeframe you trade. A wick under it is not the event. The close is. Then watch the retest. If the broken level now holds price down, the character has changed.
Most of what looks like a reversal is a pullback inside the trend. A move that has run hard pulls back to a level, scares everyone, and continues. The difference is structure. A pullback leaves the higher lows intact. A reversal breaks one and then fails to reclaim it.
Why it matters
Calling a pullback a reversal is the expensive version of this mistake. You short into a rising market at a poor price. You hold because you were sure. Then you lose twice: on the short, and on the long you talked yourself out of. Waiting for the retest saves the rest.
TraderLog puts your fills on a TradingView chart. Go back and see whether the structure had actually broken when you entered. Results by hold time show whether these attempts pay. So does the split between what you did after a win and after a loss.
Frequently asked questions
A close beyond the last swing point on your timeframe, a retest that holds, and follow-through after it.
A pullback leaves the trend's higher lows intact. A reversal breaks one and then fails to reclaim it.
Keep your Reversal trades on the record in TraderLog
Trades import from Schwab and IBKR on their own, every day lands on a calendar with its P&L, and the day's entry sits beside it. Replay any trade on a TradingView chart. Free for 14 days, no card.
Every trading morning at 8:40 ET our model draws the SPY, QQQ and IWM zones it expects to matter, on a TradingView chart, before the open. Where price reaches one, it has turned 74 percent of the time. Free, no account. See today's map