Shooting star
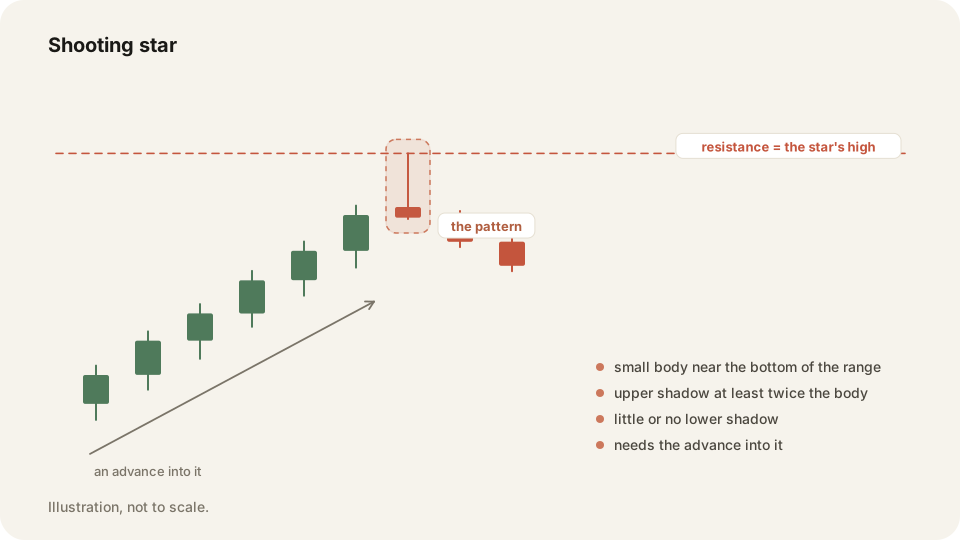
A shooting star is a single candle with a small body and a long upper wick. It forms after a rise, and its high marks resistance.
In depth
The shape says buyers pushed price up and sellers pushed it all the way back. The upper wick should be at least twice the body, with little below it. Context does the rest. Without an advance in front of it, the same shape means nothing.
The candle gives you one price, its high. Say that is 50.40. While price trades under 50.40 the line is a place to sell into. If a candle closes above it and holds, the line becomes a buy level on the retest. One line, two jobs, decided by which side price is on.
Why it matters
A single candle is not a reason to go short. It marks a level, and you still want the higher timeframe pointing down. Volume behind the move helps too. Traders who skip that end up selling into an uptrend, then get stopped by the next push higher.
Tag your reversal entries and compare them in the By tag table against everything else you take. Trade replay puts your fills on a TradingView chart. You can see whether the candle's high held or gave way.
Frequently asked questions
The shape is the same and trend decides. A shooting star follows a rise, an inverted hammer follows a fall.
Above the candle's high, and it triggers on a close beyond it, not on a wick through it.
Keep your Shooting star trades on the record in TraderLog
Trades import from Schwab and IBKR on their own, every day lands on a calendar with its P&L, and the day's entry sits beside it. Replay any trade on a TradingView chart. Free for 14 days, no card.
Every trading morning at 8:40 ET our model draws the SPY, QQQ and IWM zones it expects to matter, on a TradingView chart, before the open. Where price reaches one, it has turned 74 percent of the time. Free, no account. See today's map