Zone
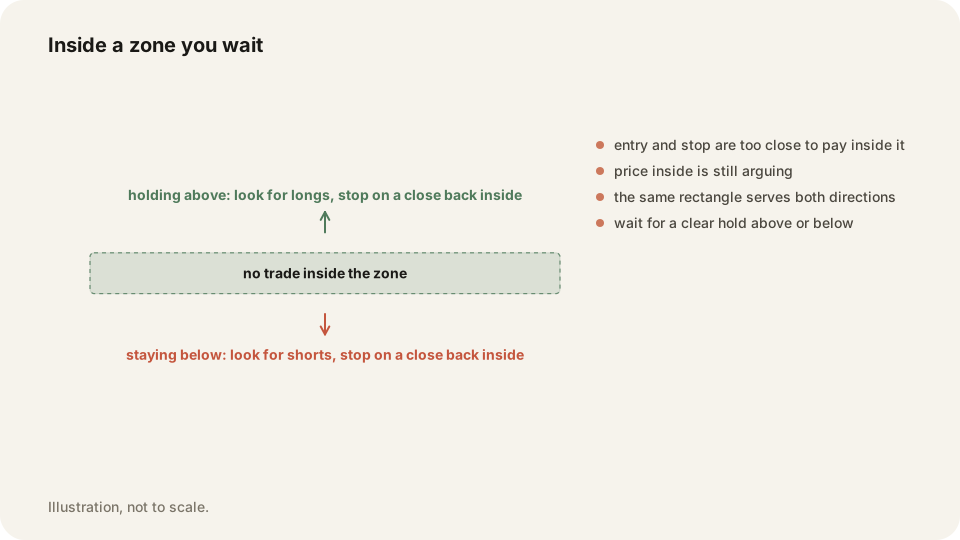
A zone is a band on the chart where several nearby levels are merged into one. Price is either above it or below it. Inside it there is no trade.
In depth
Three highs at 100.10, 100.35 and 100.48 are one obstacle. Drawn as three lines they leave you no room. An entry at one and a stop beyond another is a few cents of risk. Any wick collects that. Merged into a band from 100.10 to 100.48, they become a single decision.
How close is close enough depends on the instrument. Roughly a dollar on a large, high-priced stock, tighter on mid caps, wider on small ones. It stays a judgment call at the edges. Once the band is drawn, delete the lines inside it. A real candlestick pattern keeps its own line, because a pattern outranks a cluster.
Why it matters
Trading inside a zone is how good ideas lose money. Your entry and your stop both sit in the noise. Ordinary movement between the edges takes you out. Above and holding is a buy. Below and holding is a sell. In between, you are paying to be early.
TraderLog does not draw your levels. Put the band in the day's journal entry, with what you needed to see. Then tag the trades you took inside it. The By tag table usually settles that argument within a month.
Frequently asked questions
Several nearby support or resistance levels merged into one band. You treat it as a single obstacle.
Better not to. Entry and stop both sit in the noise, so normal movement inside the band takes you out.
Keep your Zone trades on the record in TraderLog
Trades import from Schwab and IBKR on their own, every day lands on a calendar with its P&L, and the day's entry sits beside it. Replay any trade on a TradingView chart. Free for 14 days, no card.
Every trading morning at 8:40 ET our model draws the SPY, QQQ and IWM zones it expects to matter, on a TradingView chart, before the open. Where price reaches one, it has turned 74 percent of the time. Free, no account. See today's map