A hammer without a downtrend behind it is a candle with a tail
You spotted a textbook hammer, took the long, and got run over. The shape was right. What was missing is the move that has to run into it. That check does more work than the shape ever did.
The shape was fine, the setup around it was missing
A hammer that prints after three sideways hours is a candle with a long lower wick. It reverses nothing, because nothing was happening.
The false signals people complain about usually start right there. You learn the ten shapes, you spot one, you take it. The textbook drew the shape with the prior move already sketched in behind it. So the requirement registered as scenery instead of a rule.
Every one of these patterns is a story about a fight being lost. A hammer says sellers pushed price down all session and got overrun before the close. That story needs sellers who were winning first. With no downtrend, there is nobody to overrun. The candle means about as much as the one beside it.
The move into the candle is half the pattern
Before you name a pattern, look at the twenty or so candles to its left. Ask which way price was going. A reversal pattern needs something to reverse.
Bullish patterns need a downtrend running in. Lower highs and lower lows, price under a falling average, whatever version you can see at a glance. Bearish patterns need the opposite. Get that direction wrong and the same shape turns from a signal into noise.
The honest part: nobody defines the size of that trend with a number. Three candles down does not settle it and neither does twenty. So make the call out loud. Say what the trend is before you go looking for a pattern, not after you have found one you like. Deciding in that order stops the shape from writing its own context.
The six patterns you read from one or two candles
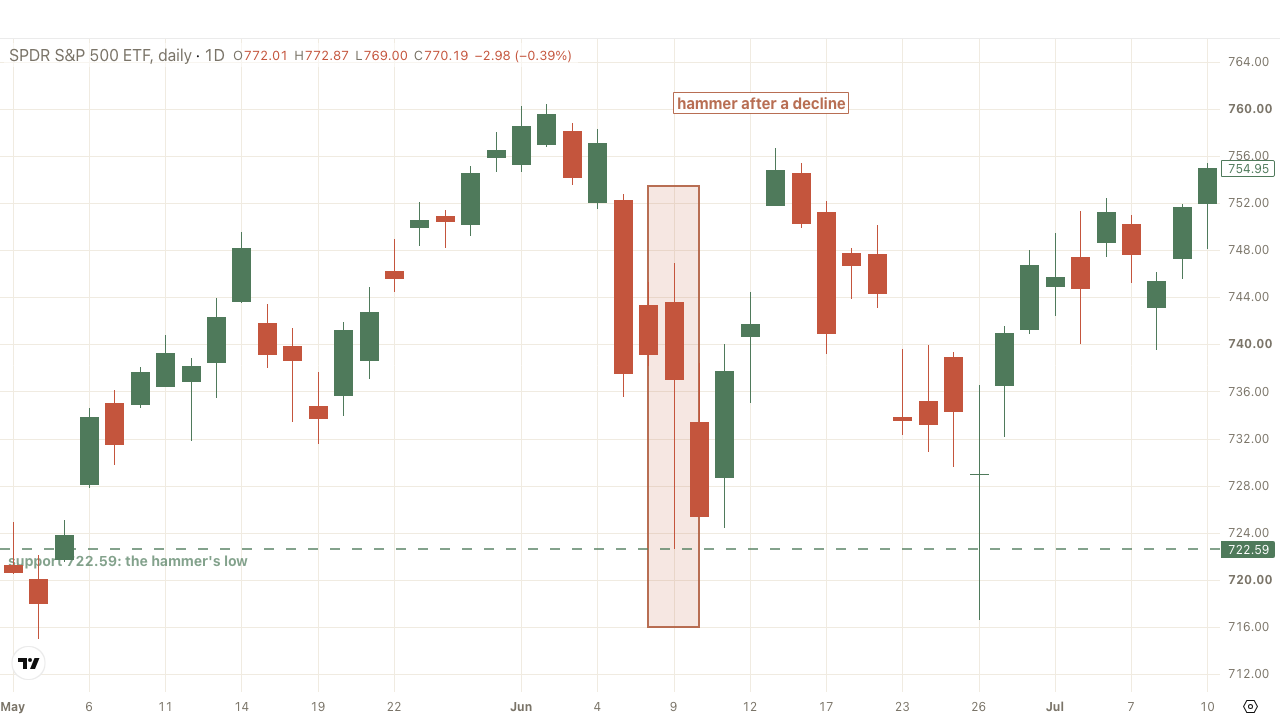
A hammer is one candle with a small body near the top and a long lower wick. It needs a downtrend into it. A shooting star is the mirror image: small body near the bottom, long upper wick, an uptrend into it.
The engulfing pair takes two candles. In a bullish engulfing, a down candle is followed by an up candle whose body covers it. A downtrend has to come first. Bearish engulfing is the reverse after an uptrend.
Piercing line and dark cloud cover are the softer versions of those two. A piercing line opens below the low of the previous down candle. It then closes back above the midpoint of that candle's body, without covering all of it. Dark cloud cover opens above the previous up candle and closes below the midpoint of its body. Both still need the trend behind them.
The stars and the two gap patterns
A morning star takes three candles. First a strong down candle, then a small indecisive one that stalls. The third is a strong up candle that recovers most of the first. The stall in the middle is the whole point. An evening star is the same shape flipped, after an uptrend.
The last two patterns are gaps. A rising window is an up gap. The low of the new candle sits above the high of the one before it, leaving untouched space between them. A falling window is the down gap version.
Draw gaps as boxes rather than lines, because the level is the whole space between those two candles. While an up gap stays open it works as support. A down gap works as resistance. Once price closes through the box, it flips and does the opposite job.
The level is the wick, and the rest is judgment
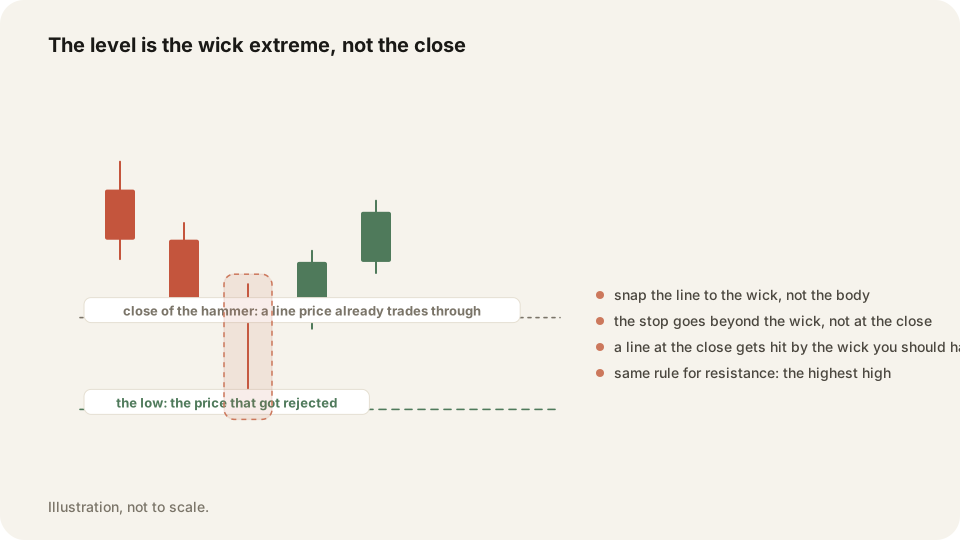
A pattern that qualifies hands you a price. Support is the lowest low of the whole pattern. Resistance is the highest high. Measure across every candle in it. Use the wick, never the body.
That price is the part you actually trade. The pattern told you where to look, and the wick tells you where the stop goes. A pattern floating in open space is close to useless for that reason. You get a shape with no level underneath it.
Several things here were never pinned to a number, and pretending otherwise would be dishonest. How long a downtrend has to run. How much volume counts as enough behind the reaction. How far past a level is far enough. You decide those yourself, write down what you decided, then check it against your results in a month.
Check a pattern before you trade it
Most of these take a second each. Run them in order and the pattern either passes or it does not.
- Name the trend on the chart to the left before you name the pattern.
- Confirm that trend runs the right way for the pattern you think you see.
- Check the pattern sits at a level you drew earlier, not in open space.
- Read the level off the wick: lowest low for support, highest high for resistance.
- Measure across every candle in the pattern, including all three of a star.
- Compare volume on the reaction candle with the hour before it.
- Check the higher timeframe is not pointing straight against the trade.
- Work out where the stop goes before you decide what you will pay to get in.
- Skip the setup when reward to the next zone is under twice your risk.
- Write the pattern name on the trade so you can count the outcomes later.
Frequently asked questions
Usually because the trend that has to run into the pattern was missing. Or the pattern printed in open space, with no level under it. Fix those two and the count drops.
No ranking survives contact with a real chart. A hammer at a level you drew last week, with volume on the reaction, wins. A textbook morning star in the middle of a range does not.
The shapes print on any timeframe. Levels drawn from 5-minute patterns rarely survive the session. Find levels on the higher charts and use the 5-minute for entry timing.
Write the pattern into TraderLog's daily entry
Each day gets a free text entry. Name the pattern you took and the trend behind it, in your own words. Your fills import from Schwab or IBKR, so the P&L beside that note comes from the broker, not memory.
Every trading morning at 8:40 ET our model draws the SPY, QQQ and IWM zones it expects to matter, on a TradingView chart, before the open. Where price reaches one, it has turned 74 percent of the time. Free, no account. See today's map