The candle that proves you were right is a terrible price
A full-bodied candle closes above your level and you buy it. The direction is correct and the trade still loses, because your stop is now a long way underneath. Fixing this costs about two minutes.
Right about direction, wrong about the price you paid
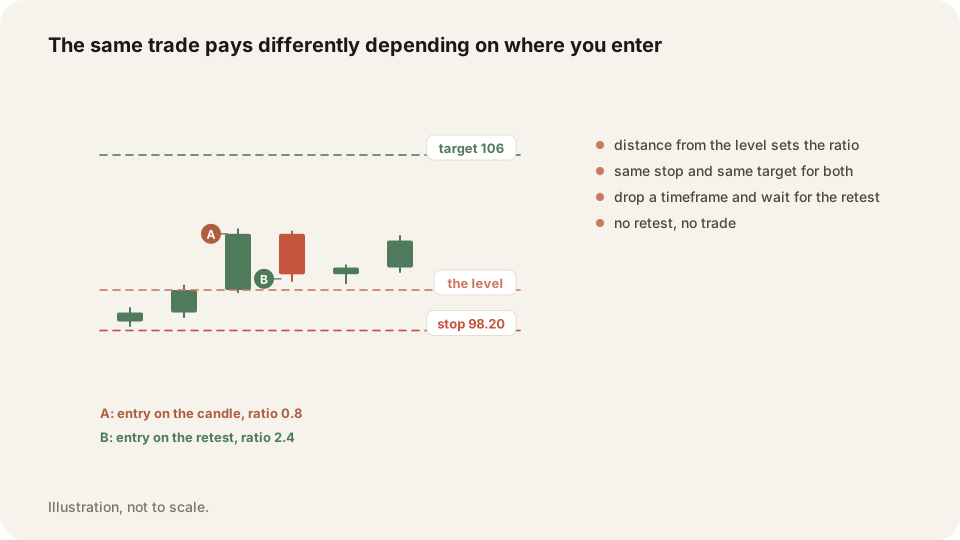
Resistance sits at 100. A 15-minute candle closes at 101.20 with a full body and you take it. That candle was the proof you had been waiting for.
Your stop still belongs under the level, call it 99.40. So you are risking 1.80 to make whatever is left up to the next obstacle at 104. That is 2.80 of reward against 1.80 of risk, about 1.6 to 1. The trade failed the two to one gate before you were even filled.
Then the ordinary thing happens. Price drifts back toward the level it just broke, which is what price does. Your stop goes on the way past. The idea was sound. The entry was not, and the entry is the part you controlled.
Drop a timeframe and buy the retest
The big candle gives you direction and nothing else. Take the entry one timeframe down, on the pullback that follows it.
After a 15-minute close above 100, go to the 5-minute. Wait for price to come back toward the level and hold there. An entry at 100.30 puts your stop 0.90 away. The same 104 target now pays more than four to one. Same idea, same stop, different price.
The retest earns its keep twice. It gives you a better price, and it tells you something. Price returning to a broken level and refusing to go back through it is the level doing its new job. If price closes back inside instead, the break failed and you keep your money.
The exact price where the setup expires
Your stop and your target both come from the chart. So one price exists above which the trade stops paying two to one. Work it out before the candle closes.
Stop at 99.40, target at 104, and reward has to be twice risk. Solve for the entry and you get 100.93. Fill at 100.93 or better and the geometry works. Pay more than that and you are buying a worse trade than the one you planned.
Draw that number as a line on the chart. Chasing stops being an argument with yourself and becomes a price you are either under or over. Widening the stop to rescue the ratio is no answer. The stop is a location on the chart, not a dial you turn.
Waiting for a second confirmation costs just as much
The opposite error empties the account slowly. You wait for the retest, then want another candle to prove the retest, then a third to prove that one. By then price is at 102 and the trade is gone.
These two instructions pull against each other and nobody has resolved them with a rule. Too early is guessing. Too late is dead geometry. The line settles it. Any fill under your maximum entry works, any fill above it does not, however convincing the candle looks.
Give the pullback a limited window. On same-day expiry, give it a few candles of your entry timeframe. No retest by then and you let the trade go. With a week of time on the contract you can afford to sit and wait for it.
Work out your maximum entry before the candle closes
Sixty seconds while the confirmation candle is still forming. The output is one number you refuse to pay above.
- Mark the level and put your stop beyond it, at the wick extreme.
- Find the next obstacle in your direction and call that the target.
- Subtract the stop from the target to get the total distance available.
- Divide that distance by three and add the result to your stop price.
- That answer is the highest price you may pay going long.
- Draw it as a horizontal line so you can see it while the candle prints.
- Drop one timeframe and wait for the pullback toward the level.
- Take the fill anywhere between the level and your maximum entry price.
- Skip the trade the moment price trades above that line.
- Set a candle count for how long you will wait, based on your expiry.
- Log the price you paid against the maximum you calculated.
Frequently asked questions
Only when its close still sits below your maximum entry price. Most full-bodied candles close too far from the level, which puts the reward to risk under two to one.
Then you miss it, and that is the cheaper outcome. Chasing a move that left your level means paying more for the same target with the same stop.
Take the distance from stop to target, divide by three, and add that to the stop. Going short, subtract it from the stop instead.
See your fill price on TraderLog's chart
Every trade opens as a TradingView chart with your fills marked. Late entries are obvious there: the mark sits well past the level. Over a month, the stats page shows what that distance did to your average winner.
Every trading morning at 8:40 ET our model draws the SPY, QQQ and IWM zones it expects to matter, on a TradingView chart, before the open. Where price reaches one, it has turned 74 percent of the time. Free, no account. See today's map