Buying has to lift price, selling only has to stop holding it up
You are hunting a volume number that nobody has ever defined. Meanwhile you skip good short setups because the bars underneath look small. The requirement was never symmetric, and knowing which side you are on removes both problems.
You are looking for a threshold that does not exist
Ask how much volume a breakout needs and you get percentages, multiples of an average, coloured bars. None of it survives a real chart. The number moves with the stock, the session and the day of the week.
So the question gets answered two bad ways. Either every breakout looks weak and you take none of them. Or any green bar counts as confirmation. Then you take all of them, including the ones that reverse in four candles.
Volume works better as a condition than a reading. Heavy participation on the reaction candle is conviction. Thin participation is a suggestion. That is the whole scale. You judge it against the candles right next to it, not against a monthly average sitting in a box.
Lifting price costs money, dropping it does not
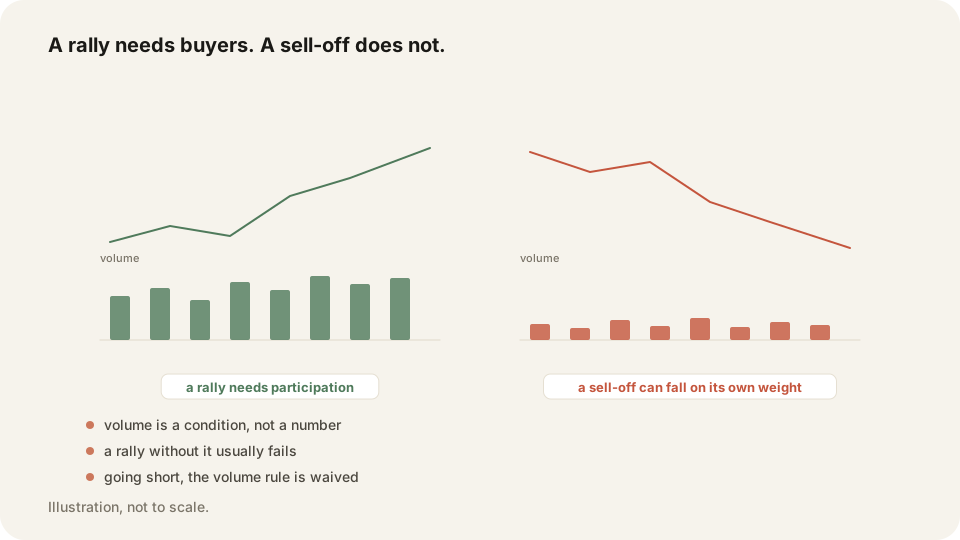
Somebody has to pay up to move a stock higher. Every tick of an advance needs a buyer willing to take the offer, and that willingness shows up as volume. An upside reversal with nothing behind it is hope with a candle drawn on it.
A sell-off needs no such thing. Bids can step away. Price falls through the space they left, and the tape can stay quiet the whole way down. Nobody has to spend anything for a stock to drop.
So the condition is one-sided. Long off support, you want visible volume on the candle that turns. Short off resistance, you can waive it. A quiet decline is still a decline, and demanding heavy volume there will cost you setups that were fine.
How to read it in ten seconds without an indicator
Look at the volume bar under the reaction candle. Compare it with the last ten or fifteen bars on the same chart. Obviously bigger is conviction. The same as everything around it is not.
Keep the comparison inside the same session and the same timeframe. Volume in the first thirty minutes dwarfs volume at noon on every chart there is. A midday bar measured against the open always looks dead. That comparison tells you nothing about the level in front of you.
The candle matters as much as the bar. A full-bodied candle closing beyond your level on heavy volume is a break. A doji on heavy volume is a fight where both sides showed up and neither won. Volume says how many people care. The candle says who won.
Where this stays a judgment call
No number has ever been attached to enough. The instruction is heavy or thin, judged by eye, on the chart in front of you. Say that plainly, because an invented threshold buys you confidence you have not earned.
Two practical guards. Put volume last in your checks, after the level and the pattern. It confirms an idea rather than starting one. And when price reacts to a level on nothing much, treat it as a half-size trade instead of a skip.
One thing volume cannot do is promise follow-through. Fakeouts print big bars too, because filling large orders is the entire point of the move. That is why your exit rule stays a close beyond the level rather than a wick through it. The bar tells you people traded. It never tells you they were right.
Use volume as the last check, not the first
Five seconds per setup, in a fixed order. The output is a yes or a no, plus a size.
- Confirm price is at a level you drew before the session.
- Confirm a reversal pattern with the right trend behind it.
- Only then look at the volume bar under the reaction candle.
- Compare it with the ten or fifteen bars beside it, same chart, same session.
- Going long, require volume that is obviously bigger than its neighbours.
- Going short, take the setup without it and note that you did.
- Check the candle body as well, since a doji on heavy volume is a stalemate.
- Ignore any comparison with the opening thirty minutes after the first hour.
- Halve your size when the level holds on nothing much.
- Keep the exit on a candle close beyond the level whatever volume printed.
- Log the volume call as heavy, thin or unclear on every trade.
Frequently asked questions
An upside breakout does, because someone has to pay up to lift price. A downside break can happen on thin volume, since price falls through the space where bids used to be.
There is no defined number, and any figure you are given was invented. Compare the reaction bar with the ten or fifteen bars next to it on the same chart.
Selling can happen through absence. Buyers step back, and price drops with nobody spending anything. Rising prices need active participation, so they leave a bigger footprint.
Check your volume read in TraderLog
Write your volume read in the day's journal entry before you judge it. TraderLog imports the fills from Schwab or IBKR, so the result sits next to the note. Trade replay shows the bar you bought on.
Every trading morning at 8:40 ET our model draws the SPY, QQQ and IWM zones it expects to matter, on a TradingView chart, before the open. Where price reaches one, it has turned 74 percent of the time. Free, no account. See today's map