A 70 percent win rate can still bleed an account
You close more winners than losers and the balance keeps sliding. The cause is arithmetic, and your own fills will show it in about ten minutes. This walks through the calculation and the three habits that produce it.
A high win rate hides the size of your losers
Win rate tells you how often you were right. It says nothing about how much you made when you were right.
The pattern has the same shape in almost every account that has it. You take the profit at plus 80 because green on the screen feels like safety. Then one trade goes against you, you give it room, and it closes at minus 250. Eight small wins get wiped out by three of those.
Your statement shows 70 percent winners and a red month. Both numbers are honest. Win rate is the wrong one to steer by.
The fastest tell is your two averages. Pull the average winner and the average loser in dollars and set them side by side. When the loser is more than twice the winner, a 70 percent hit rate is still a losing system.
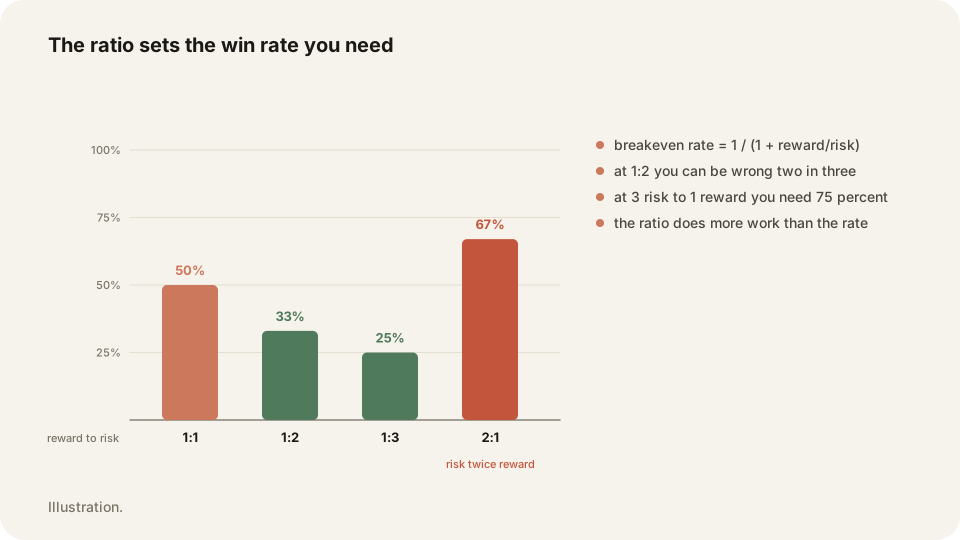
Every reward to risk ratio has a breakeven win rate
Below that line you lose, above it you make money. Costs push the line a little higher than the arithmetic says.
Risk 100 to make 100 and you need half your trades to work. One winner covers one loser, so breakeven sits at 50 percent. Risk 100 to make 200 and 33.3 percent is enough, because a single winner pays for two losses.
Turn the ratio around and it gets ugly. Risk 200 to make 100 and you have to win two out of every three trades. Two winners barely cover one loser. That is 66.7 percent, and it has to hold through every rough patch you hit.
Work out which of the three describes your last month. The answer sits in your average winner and your average loser, and finding it takes a minute.
Expectancy settles the argument in one line
Multiply your win rate by your average winner. Then multiply your loss rate by your average loser and subtract it. What is left is what one trade is worth to you.
Take the account described above: 70 percent win rate, average winner 80 dollars, average loser 250 dollars. That gives 0.7 times 80, which is 56. Then 0.3 times 250, which is 75. Fifty six minus seventy five leaves minus 19 dollars.
So every trade you place costs you 19 dollars on average. Forty trades a month hands back around 760 dollars before commissions. Nothing about your entries has to change for that to be true.
Run the same line on your own fills. If the number comes out positive, the conversation is about size. If it comes out negative, the conversation is about exits.
Go after the average loser first
It is the number you control with a written rule. It also moves the fastest.
Three habits produce this exact profile. You close winners the moment they turn green, so your average winner ends up near your commission. You hold one loser past your level, and it becomes the biggest trade of the month. And you size up on the setup you feel surest about, which converts a normal loss into a double one.
The repairs are mechanical. Write the target before the entry, then let price reach it or stop you out. Fix your risk per trade as a dollar amount and let the stop distance decide the share count. Take partials if you want the relief, but leave a runner for the target.
Do that for twenty trades and watch the average loser fall. Your entries never had to change.
What to pull from your journal in ten minutes
You need four numbers and one sorted list. Any journal or broker export will give you these.
- Filter to your last 100 closed trades and ignore anything older.
- Read off win rate, average winner and average loser in dollars.
- Multiply win rate by average winner and write the number down.
- Multiply loss rate by average loser and subtract it from that number.
- Confirm commissions and fees are already inside both averages.
- Sort losers largest first and mark every one bigger than your planned risk.
- Count how many of those oversized losers had the stop moved.
- Compare your average winner against the target you wrote before entry.
- Repeat the same arithmetic separately for each setup tag.
- Write one rule that caps your worst loss, then log every trade against it.
Frequently asked questions
Yes. At 1:2 reward to risk the breakeven point is 33.3 percent, so 40 percent is profitable before costs. Your winners do have to reach the target for that to hold.
Usually commissions, or partial fills counted as separate trades. Importing fills straight from the broker keeps both on the same numbers.
The average winner, in most situations. Your win rate is set by the market and the setup. The size of your winners comes from an exit rule you control.
See your real expectancy in TraderLog
Win rate alone hides this. TraderLog's stats page puts average winner next to average loser, with profit factor and expectancy in dollars per trade. Imported fills mean broker prices and broker P&L, so nothing gets rounded in your favour.
Every trading morning at 8:40 ET our model draws the SPY, QQQ and IWM zones it expects to matter, on a TradingView chart, before the open. Where price reaches one, it has turned 74 percent of the time. Free, no account. See today's map