Six zones, drawn once, before the open
Your chart has thirty lines on it and none of them stops you doing anything. Zones drawn from wick extremes, with the overnight candles switched off, leave you with a short list you can trade.
After-hours candles put your levels at prices nobody defended
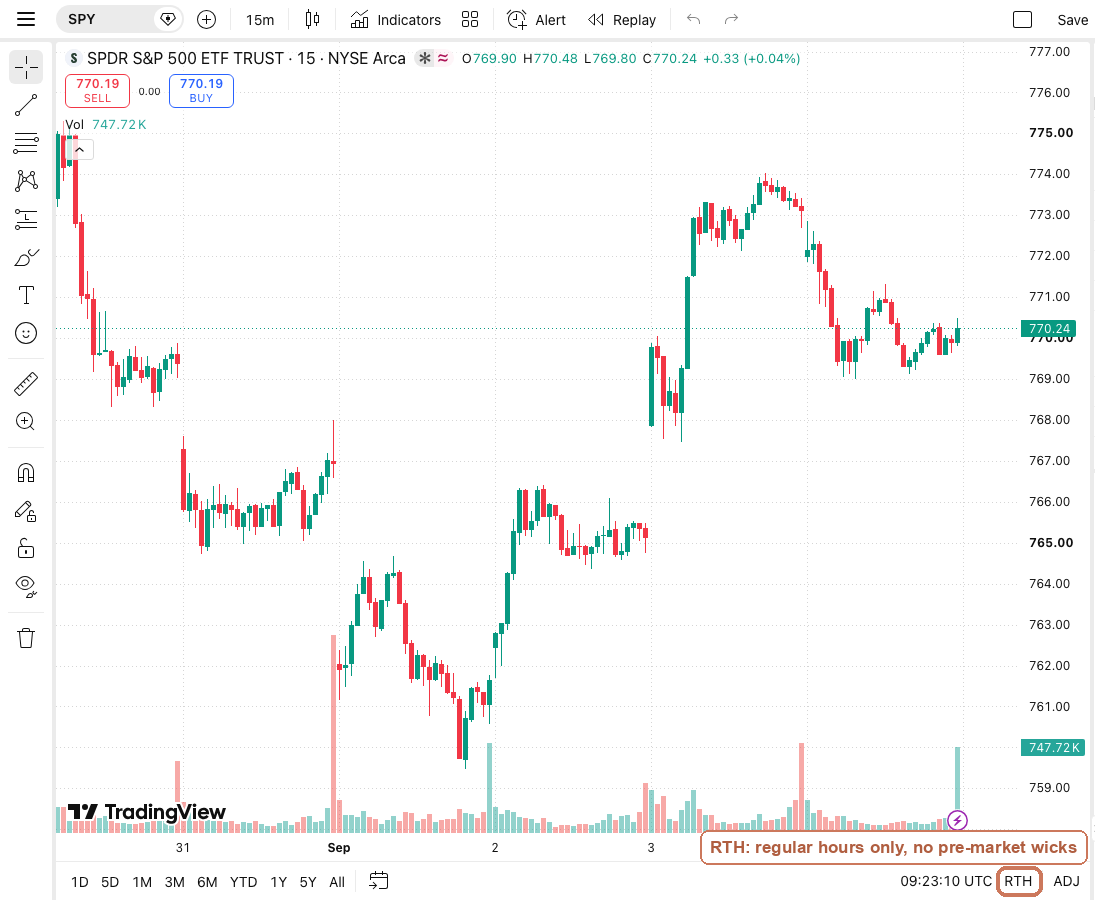
Turn extended trading hours off before you draw anything. The toggle sits at the bottom right of the chart, and again in the symbol settings.
Overnight and pre-market prints come from thin books. One 400 share trade at 3 am can leave a wick two dollars past anything the regular session touched. Draw on that wick and you have marked a price the day session never argued about.
Zones are worth having because size traded there and both sides showed up. That is a regular hours event.
There is a second reason to switch it off. The zones you trade should come from the session you trade. Mixing in overnight prints hands you levels that only existed while the desk was empty. You find that out at 10:15.
Daily first, then 4-hour, then 1-hour, drawn with the rectangle tool
Work backwards from the current candle. Read left one candle at a time and stop at reversal patterns. Hammers, shooting stars, engulfing candles, morning and evening stars, gaps.
Mark the extreme, not the body. Support is the lowest low of the pattern and resistance is the highest high, wick included.
Gaps get a box. Drag the Rectangle tool across the untraded space between the two candles, edge to edge. Once price closes through that box, the box changes sides, and broken support becomes resistance.
Do the daily chart first, then the 4-hour, then the 1-hour. Keep each new extreme that survives on the way down. Extremes landing within about a dollar on a large cap belong in one zone. Widen the rectangle instead of drawing a second one. Scale that dollar to what you trade.
Two colours, six zones, and nothing else on the chart
Colour supports one way and resistances another, and keep it identical on every symbol. After a week you read the chart without thinking about which is which.
Then cut. Three zones above price and three below is enough for a session. Delete everything that missed the list, including the level you were proud of in March.
Save the layout when you are done. Drawings are stored per symbol, so tomorrow's chart opens with the same boxes on it.
Two habits make the zones usable. While price sits inside a zone you do nothing. The zone is the argument, and it has not been settled yet. Each zone also works both ways. It is a place to sell while price trades below it. It becomes a place to buy once price holds above it.
The same job, done by a model, every morning on SPY, QQQ and IWM
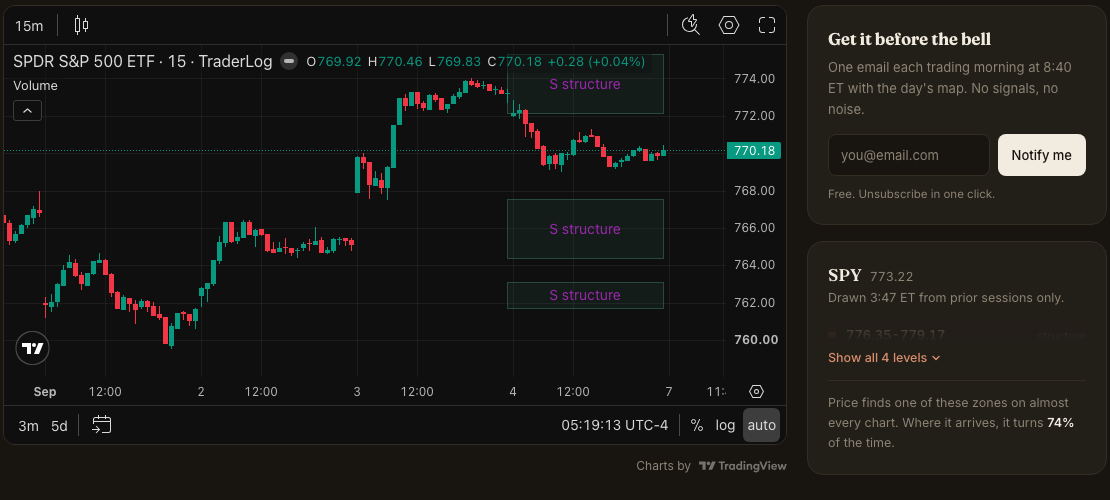
TraderLog publishes a Morning Map at traderlog.co/morning-map. Every trading morning at 8:40 ET the model draws its zones on SPY, QQQ and IWM. It marks the support and resistance it expects to matter that day.
It reads prior sessions only, so nothing on the page depends on what happens after the open. The zones sit on a TradingView chart, since TraderLog runs TradingView's Advanced Charts under licence. The page is free and needs no account, and there is a free 8:40 ET email with the day's zones.
The page carries a measured number. Where price reaches one of these zones, it turns 74 percent of the time.
A turn counts like this. After price first touches a zone, it moves at least 0.15 percent away from the zone midpoint. That move has to go in the zone's direction, within 20 minutes. Every zone is drawn before the open and scored after the close, across all of them since mid-August.
Twelve steps to a chart with six zones on it
Once a week for the daily and 4-hour work, once a morning for the 1-hour. Fifteen minutes the first time, five after that.
- Turn extended trading hours off before you draw anything.
- Start on the daily chart and work backwards from today.
- Stop at reversal patterns and gaps, ignore everything else.
- Mark the wick extreme of each pattern, not the body.
- Repeat on the 4-hour, then on the 1-hour.
- Draw gaps as rectangles covering the untraded space.
- Merge extremes within about a dollar into one zone.
- Colour supports one way and resistances another.
- Keep three zones above price and three below.
- Delete every drawing that missed the six.
- Save the layout so the zones are there tomorrow.
- Flip a zone's role once price closes through it.
Frequently asked questions
Zones. The extremes that matter cluster within a few cents of each other. A single line claims a precision the tape does not have.
Daily, 4-hour and 1-hour, in that order. The daily gives zones that hold for weeks, and the 1-hour gives you something to trade against today.
Drawings are saved per symbol, so every ticker keeps its own boxes. Save the chart layout too, so your session settings come back with them.
See your zones again in TraderLog replay
TraderLog runs TradingView's Advanced Charts under licence, so each imported trade reopens on a real chart. Your entry and exit are marked on it. Redrawing the zone there tells you whether the one you drew before the open held.
Every trading morning at 8:40 ET our model draws the SPY, QQQ and IWM zones it expects to matter, on a TradingView chart, before the open. Where price reaches one, it has turned 74 percent of the time. Free, no account. See today's map