Six zones, drawn from candles, and nothing else on the chart
You have levels on your chart and price still stops in places you never marked. Usually that is because the lines came from round numbers and a Fibonacci tool rather than from anything that happened. This is the procedure that replaces them.
A line you cannot justify will not hold price
A level only earns a line when something happened there. Round numbers, yesterday's high and a Fibonacci grid are not events. They are conveniences, and price runs through them whenever it feels like it.
Keeping them has a cost you can watch in your own results. Eleven lines on a 15-minute chart means price is always near one of them, so every setup looks confirmed. The lines have stopped filtering anything. You take the trade you would have skipped, and then the loss gets blamed on your entry timing.
Shrink the definition instead. A level marks a spot where buyers or sellers already turned the tape. You can point at the candles that prove it. No candles, no line. Erase the rest before the open.
Ten reversal patterns produce every level you need
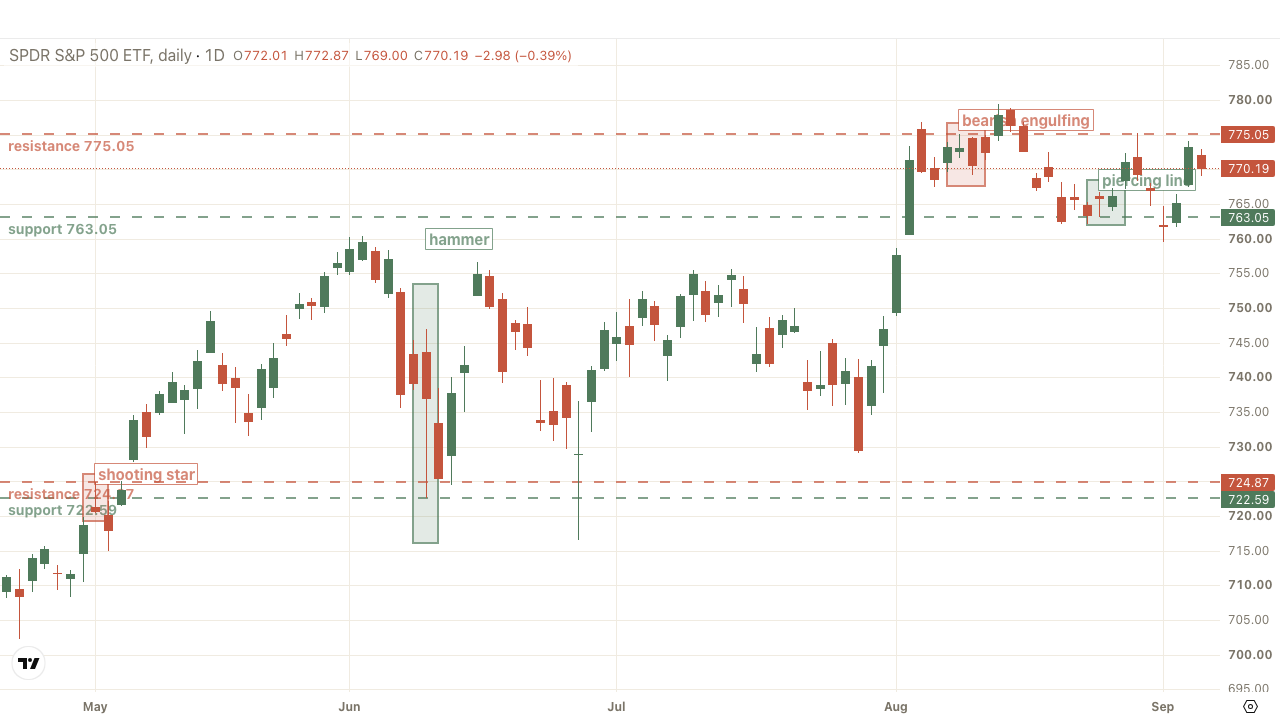
Levels come from the extremes of ten candlestick reversal patterns and nothing else. Hammer, shooting star, bullish engulfing, bearish engulfing, piercing line, dark cloud cover, morning star, evening star. Then the two gap patterns: a rising window when price gaps up, a falling window when it gaps down.
Support is the lowest low of the pattern. Resistance is the highest high. Take the wick, not the body. The wick is where price traded and got pushed back, and that print sits on everyone else's chart too.
One gate decides whether a shape counts, and it is the move running into it. A hammer needs a downtrend behind it. A shooting star needs an uptrend. A hammer shape in the middle of a flat drift is a candle with a long tail. The level you draw from it leaks.
Three charts, regular hours, walking backwards from now
Draw on the daily, the 4-hour and the 1-hour. The 5-minute produces a level every hour and almost none survive to lunch. Leave it alone until you are timing an entry.
Switch the chart to regular trading hours before you start. Overnight candles print on thin volume and leave wicks that nobody defends the next day. If your platform includes pre-market by default, that setting is adding fake levels to every chart you open.
Start at the current price and work left, one candle at a time. Every time you hit a qualifying pattern, mark its extreme and keep going. A level survives only if price has not already closed through it since. On the daily you rarely need more than a few months of history. Anything older has usually been cut through already.
Merge what sits close together, then keep six zones
Two levels a few cents apart are one level. On a large-cap stock in the hundreds, anything within about a dollar of another level joins the same zone. Scale that distance with the share price. A 30 dollar stock needs a tighter merge than a 600 dollar one.
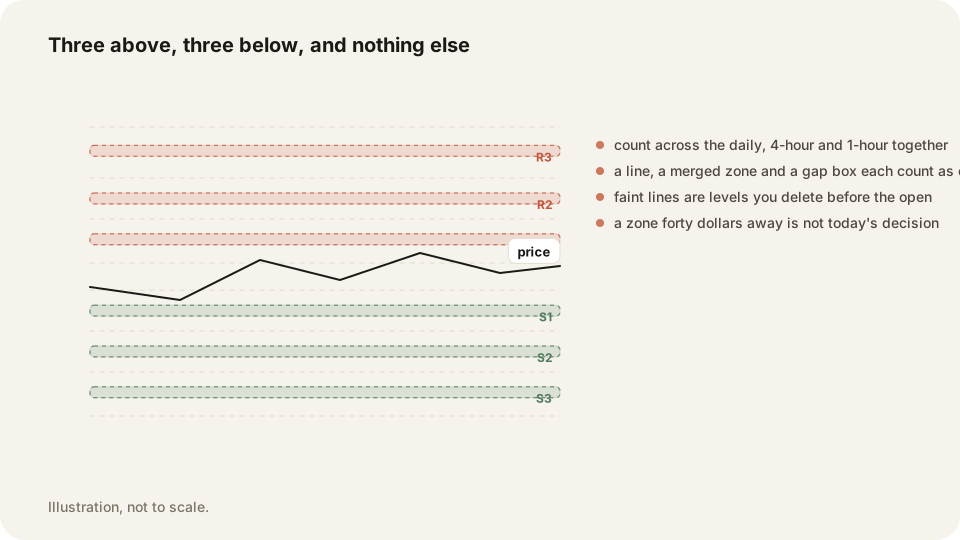
Draw the merged zone as a rectangle running from the lowest extreme in the group to the highest. Then cut the chart down. Keep the three nearest zones above price and the three nearest below, and delete everything else. Six is enough to plan a session. A zone 40 dollars away is not a decision you make today.
Nobody can hand you a maximum zone width. That one is judgment. If the rectangle is so tall that a stop beyond it would break your risk, you merged too much. Split it back into two.
Inside a zone you wait, and every zone works both ways
A zone is a no-trade area. Price inside it is still arguing, and those candles are the least reliable ones on the chart. Wait until price is clearly above the rectangle or clearly below it before you do anything.
The same rectangle serves both directions. While price sits under it, that is where you look for shorts and where you take profit on longs. Once price closes above it and holds, the same rectangle becomes the place you want to buy a pullback into. Broken support turns into resistance, and broken resistance turns into support.
So do not delete a zone the moment it breaks. Keep the rectangle and change what you do with it. The levels you drew on Sunday are still the levels on Thursday. Price sitting on the other side of two of them changes nothing.
The drawing routine, start to finish
Run this once a week per symbol, and again after any day that closes outside your zones. Ten minutes a chart, once you stop second-guessing the patterns.
- Set the chart to regular trading hours and switch off pre-market and after-hours.
- Open the daily chart and put your cursor on the current price.
- Walk left one candle at a time and stop at each of the ten reversal patterns.
- Check the trend running into the pattern before you accept it as valid.
- Mark support at the pattern's lowest low and resistance at its highest high.
- Use the wick extreme every time, never the open or close of the body.
- Draw gaps as a box between the two candles rather than as a single line.
- Skip any level price has already closed through, unless you want it as a flipped level.
- Repeat the whole walk on the 4-hour, then on the 1-hour.
- Merge levels within about a dollar on a large cap into one rectangle.
- Delete every zone except the three nearest above price and the three nearest below.
- Write those six prices somewhere you can read them without changing charts.
Frequently asked questions
Three zones above price and three below. Anything further out is not a decision you make today, and extra lines make every setup look confirmed.
Not on their own. If a reversal pattern happens to end near 500, the level is that pattern's wick. The round number is a coincidence.
The wick. That extreme is where price traded and got rejected, and it is the price sitting on other traders' charts. Bodies hide the rejection.
Get the Morning Map zones before the open
The Morning Map draws the model's support and resistance zones for SPY, QQQ and IWM. It lands as a free page and a free email at 8:40 ET. Draw your own zones first, then see where the two disagree.
Every trading morning at 8:40 ET our model draws the SPY, QQQ and IWM zones it expects to matter, on a TradingView chart, before the open. Where price reaches one, it has turned 74 percent of the time. Free, no account. See today's map