Decide what counts as holding before price gets there
Price is two cents through your line and you are already reaching for the mouse. The tell sits in the shadow, the volume behind it and the close. You can write that rule down beforehand.
Nobody can tell you in advance whether the level holds
The honest answer is that you find out afterwards. What you can do beforehand is decide what you will accept as proof that it held.
Without that definition you improvise. Price dips two cents through your line and you are out. Or it closes a full point under and you are still hoping for a bounce.
So change the question. Instead of asking whether 98 will hold, ask what price has to do at 98 before you act. That version has an answer you can write down the night before.
It also makes the trade reviewable. When you know what you were waiting for, you can check later whether it appeared. A trade you improvised teaches you nothing at the weekend.
A hold is a refusal you can see on the candle
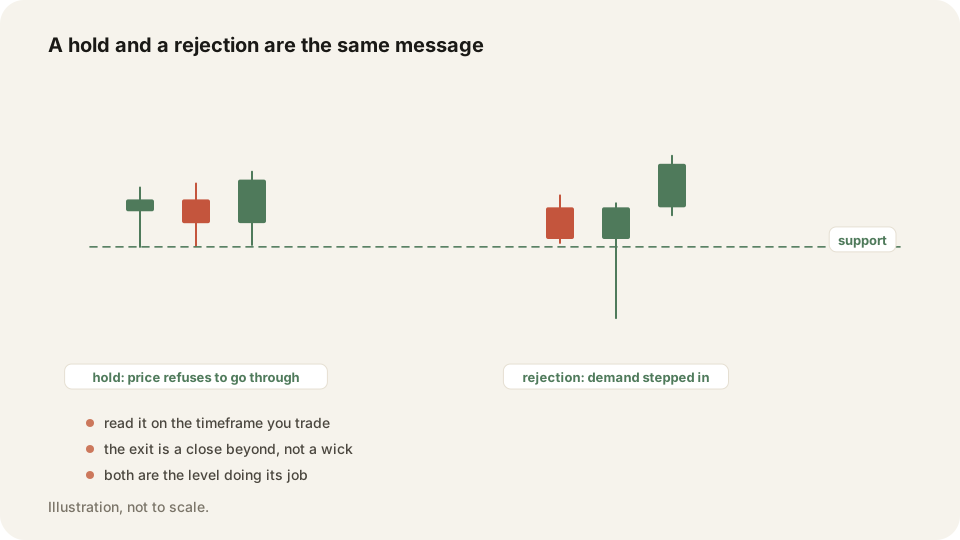
Price arrives at the level and will not go through. That refusal prints as a shadow, and the shadow is the part worth reading.
A long lower shadow at support means sellers pushed price down and buyers took all of it back. A long upper shadow at resistance means supply showed up and capped the move.
The body tells you where the fight ended. The shadow tells you who lost it. At a level from a higher timeframe, one long shadow says more than three small green candles.
What you do not want is price grinding sideways on the line. No shadow means neither side committed. That is a zone, and a zone is a place to wait rather than a place to buy.
Let the close decide
A wick through your level has not stopped you out. A candle that closes beyond it has.
Work it through. Support sits at 98, price trades down to 97.60, and the candle closes at 98.30. The level held, and the wick was the shake-out.
Now take the same candle closing at 97.80. You are out on that close, on the timeframe you entered on. Picking that timeframe before you enter turns this from a feeling into a rule.
The rule is easy to state and hard to sit through. The wick is the part that hurts. It is also where weaker holders get pushed out, which is the liquidity a real move needs.
Watching that print without touching anything is the skill. Set the alert on the close, then leave the mouse alone until it fires.
Volume tells you whether anyone showed up
Lifting price takes participation. Price can fall under its own weight, so a sell-off needs no help, while a bounce off support does.
A reversal up on thin volume is a suggestion. The same reversal with a volume spike is a crowd. Look at the bar under the candle that made the shadow and compare it to the bars either side.
How much volume is enough is never given a number. It is a judgment call you build with screen time, and anyone handing you a threshold invented it.
The asymmetry is worth remembering when you are short. A level breaking down on ordinary volume is still a break. A level bouncing on ordinary volume is a level you should be slower to trust.
What a hold looks like on your entry chart
The level comes from the daily, four hour or one hour chart. The hold shows up on the chart you actually trade.
On a five minute entry chart you want one candle that pushes into the level and closes back out. Then a second candle that fails to take out the first candle's extreme.
That is enough to act on, because the stop is already defined by the level. Get in as close to it as the market lets you.
Distance from the level is what ruins the ratio. Entering a point above support with the stop under it needs a much larger target to pay the same. Beginners give that away for free, then blame the level when the trade does not work.
What to check while price sits at your level
Run this while the candle is still forming. If you cannot answer a line, the answer is no trade yet.
- Confirm the level came from a candle pattern extreme, not from a round number.
- Write down which timeframe's close will trigger your stop.
- Watch the shadow on the candle that touches the level.
- Compare that candle's volume to the bars beside it.
- Wait for a close back out of the level before entering.
- Enter as close to the level as the spread allows.
- Place the stop beyond the level, not a fixed number of cents away.
- Measure reward against risk on the chart before you commit.
- Do nothing while price is still inside the zone.
- Note in your journal whether the level held or broke.
Frequently asked questions
You watch what the candle does at it. A long lower shadow with a close back above the level is a hold you can trade.
No. Only a candle close below the level counts, read on the timeframe you are trading.
Until the candle that matters closes. While price is inside the zone there is no trade to take yet.
Write your holding rule in TraderLog
Decide what counts as holding, then write it in the day's journal entry in TraderLog. When the fills import from Schwab or IBKR, replay puts the trade back on a chart. You can see whether the level did what you said.
Every trading morning at 8:40 ET our model draws the SPY, QQQ and IWM zones it expects to matter, on a TradingView chart, before the open. Where price reaches one, it has turned 74 percent of the time. Free, no account. See today's map