Plan on one chart, review on the same chart
You marked the level at 9:15 and took something else at 9:47. By the evening the chart has moved on and the reason is gone. Reviewing the fills on the chart you planned on fixes that.
By the evening the chart no longer shows what you saw
Charts overwrite themselves. The 5-minute chart you traded at 9:47 looks different at 9 pm. The rest of the day is drawn on it now.
So the review turns into a story you tell yourself. You remember waiting for the level. The chart shows an entry eleven cents late, three candles after the pattern, with the hourly pointing the other way.
A spreadsheet cannot argue with you either. A row holds a ticker, two prices and a number. Nothing in it can show that you chased.
The workflow that fixes this is dull and it works. Plan on a chart and keep the plan. At review time, put the real fills back on the same kind of chart. Evidence and memory sit side by side, and the memory usually loses.
Do the drawing before the open, on the chart you trade
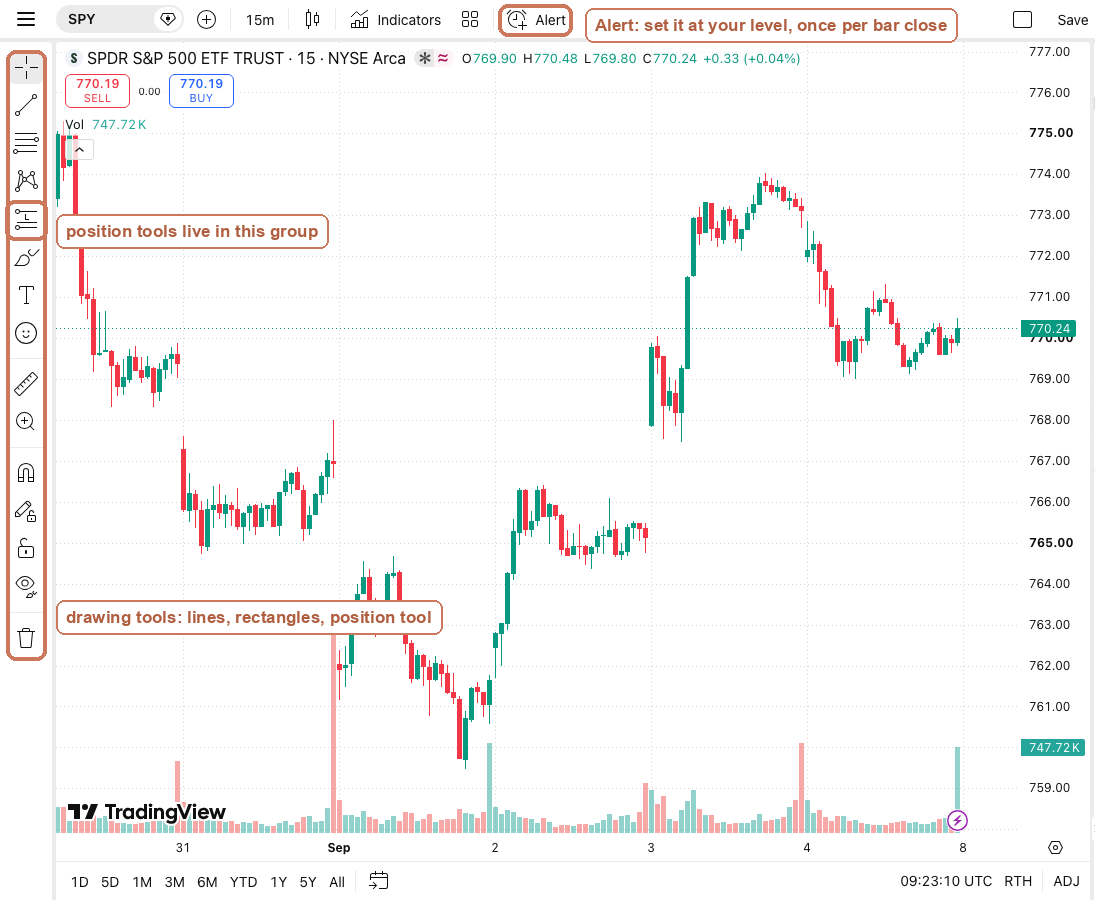
Pre-market is for drawing, not for trading. Open TradingView, mark your zones with the Rectangle tool, and stop once you have three above price and three below.
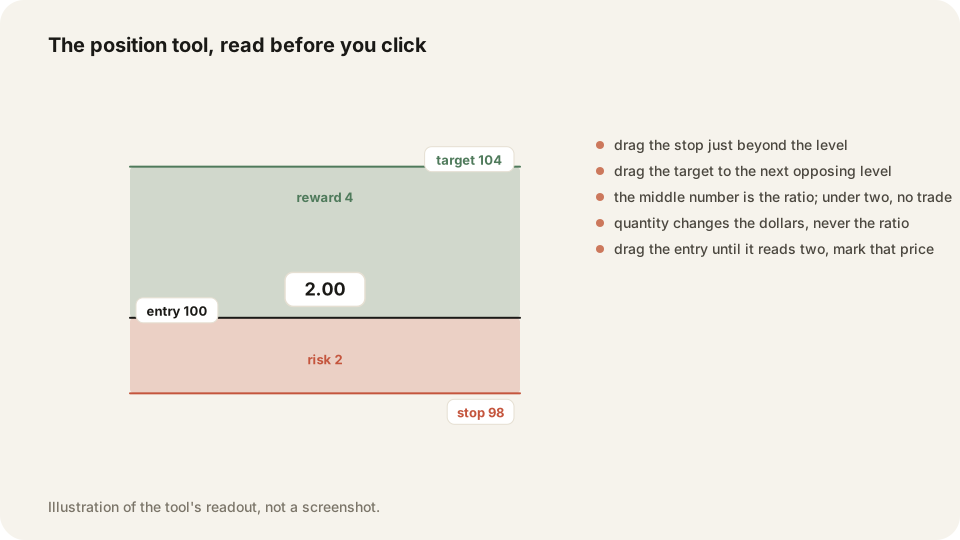
Then price the trade before you want it. The Long Position and Short Position tools sit in the left drawing toolbar, under the prediction and measurement group. Drag one from your entry to your stop and target. The box prints the reward-to-risk ratio in the middle.
If that number reads under 2, the setup has expired. Widening the stop to make the box look better is the wrong answer, because the stop came from the chart.
Set an alert on each zone from the Alert button in the top toolbar, or by right-clicking the price level. Two of those six will matter today, and you do not know which two. Save the layout. Drawings are stored per symbol, so tomorrow starts where you stopped.
Let the journal collect the fills, then look at the trade on a chart
Execution happens at your broker. TraderLog imports the fills from Schwab and IBKR, or from a CSV. Nothing depends on you typing prices at 4 pm.
Every trading day lands on a calendar. Open a trade and the replay drawer puts it back on a chart. Your entry and exit are marked, on bars from TraderLog's own market data. The charts inside TraderLog are TradingView charts, running TradingView's Advanced Charts under licence.
That closes the loop. Plan and review show the same bars, so the excuse that it looked different at the time runs out.
What you are checking is narrow. Where was the zone, where did you actually get in, and how far had price already travelled when you clicked. Three answers, one minute per trade.
The notes panel holds one trade, the journal holds the pattern
TradingView gives you a notes panel and a paper trading panel. Both are handy during the session for a single idea. Neither imports your real fills, and neither adds them up across a month.
Use them for what is happening on the chart right now. Use the journal for the questions that need forty trades to answer.
Those questions are boring and expensive. Win rate, average winner against average loser, profit factor, expectancy, R-multiples. Whether your Tuesday afternoon trades pay for themselves. Whether the setup you like best is the one making the money.
Tags and custom rules do the sorting. Log each trade against the rules you wrote. The AI review then flags the behaviour you already suspect. Sizing up after a loss, trading more on a red day, breaking the rule you wrote in July.
The daily loop, from pre-market drawing to evening review
Eleven steps. Twenty minutes before the open, ten minutes after the close, and your broker handles the middle. None of it needs a second monitor.
- Turn extended trading hours off before you draw.
- Mark three zones above price and three below.
- Drag the position tool from entry to stop to target.
- Reject any plan that prices under two to one.
- Set one alert per zone from the Alert button.
- Save the chart layout before the open.
- Place the order at your broker.
- Let TraderLog import the fills instead of typing them.
- Tag the trade the same day, while the reason is fresh.
- Open the replay drawer and check your entry against the zone.
- Write one line about what you would repeat.
Frequently asked questions
It has notes and a paper trading panel, which cover one idea at a time. It does not import your broker fills or produce win rate, profit factor and expectancy.
No. TraderLog imports fills from Schwab, IBKR and CSV, and your drawings stay on your own TradingView charts. The charts inside TraderLog are TradingView charts under licence.
The free plan covers drawing zones, the position tool and a limited number of alerts. Paid plans raise those limits if you run out of alert slots.
Plan and review on the same TraderLog chart
TraderLog imports your fills from Schwab and IBKR, then puts each trade back on a TradingView chart. The entry and exit are marked, so you review on the same chart you drew. There is a 14-day free trial and no card.
Every trading morning at 8:40 ET our model draws the SPY, QQQ and IWM zones it expects to matter, on a TradingView chart, before the open. Where price reaches one, it has turned 74 percent of the time. Free, no account. See today's map