Merge distance scales with the price of the thing you trade
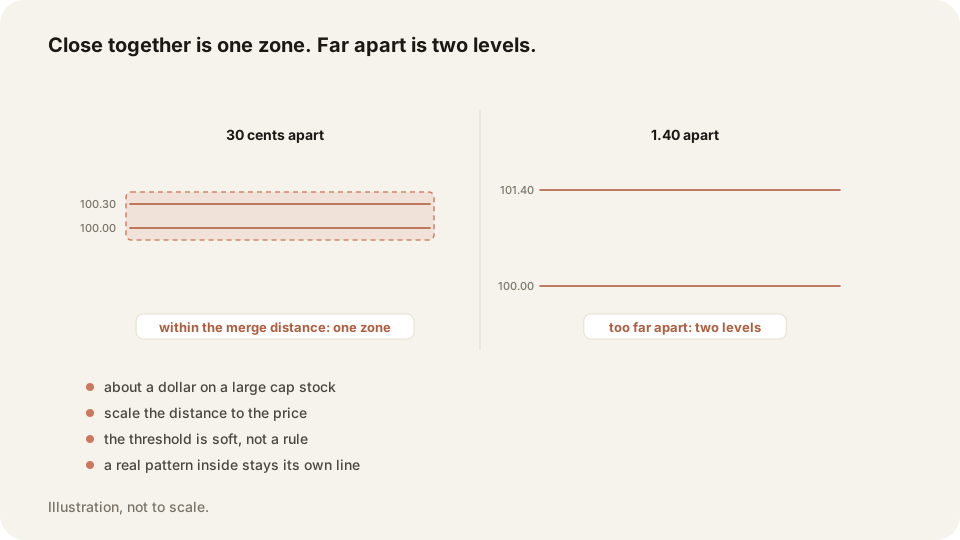
Two levels twenty cents apart leave no room for a stop, so one of them has to go. Merging them into a single box fixes the geometry. The distance that counts as close changes with the instrument, and it has never been pinned to a formula.
Two levels too close together cancel each other out
Say you have support at 99.90 and another support at 99.65. Both look real. Both came off the chart honestly. Together they have made the trade untakeable.
Buy at 100.00 with the stop under the nearer one at 99.85 and you are risking 0.15. Price trades between the two supports all morning, so ordinary noise takes you out before the idea has resolved. You were right and you are still flat.
Put the stop under the lower one at 99.60 instead and the risk becomes 0.40. Fine, except your entry at 100.00 is now 35 cents above the level you are betting on. The distance is the problem, and every cent of it comes out of your reward.
Merging is the repair. One box from 99.65 to 99.90, one entry area just above it, one stop under the whole thing. Two obstacles become one decision.
Merge distance is a fraction of price, not a fixed number of cents
A working rule of thumb: about a dollar on a large, high-priced stock. Tighter on a mid cap, because a dollar there is a big part of the daily range. Wider again on a cheap small cap that routinely covers several percent in a session.
The question underneath is always the same. If I stood between these two levels, would the move be worth trading? Twenty cents on a 400 dollar stock is not a trade. Twenty cents on a 6 dollar stock might be the whole day.
Futures sit outside this rule of thumb entirely, since they price in ticks and points rather than dollars per share. Work out the equivalent from the instrument's own daily range instead of importing an equities number.
So you are not measuring cents. You are measuring what fraction of a normal move sits between two lines. If that slice cannot pay for a stop, merge them.
In practice the merges land somewhere between twelve and fifty cents
On a high-priced large cap, pairs twelve, eighteen, twenty-four, twenty-five and fifty cents apart all merge comfortably into one zone. A pair more than fifty cents apart usually stays as two destinations. There is a real trade between them.
That range is a rule of thumb from watching one class of instrument. It is not a threshold you can code. The gap between merging at fifty and refusing at fifty-five is judgment. Anyone selling you a precise threshold made it up.
What makes it usable is the consistency, not the accuracy. Pick your working distance for each name you trade and apply it the same way every night. Then your charts stop drifting week to week, and you can compare a Tuesday setup to a Thursday one.
Write the distance down per ticker. Ten seconds of admin removes an argument you would otherwise have with yourself every morning.
Stretch a zone when the move left over is not worth taking
Sometimes merging leaves one straggler just outside the box. A level twenty cents beyond the edge, on a name where your merge distance is a dollar. Technically it stands alone. Practically it ruins the chart.
Ask what the trade between the box edge and the straggler would pay. Entry at the edge, stop below the box, target the straggler. That is 40 cents of risk against 20 cents of reward. There is no trade there, so fold the straggler in and widen the box.
Now flip it. If the leftover run is a dollar and change on the same name, that is a trade worth having. Keep them separate, even though they are close, because the space between them pays.
The deciding question is never the distance on its own. It is whether the leftover distance clears your reward-to-risk gate.
A real pattern inside the merge distance keeps its own line
Clustering is weak evidence. A candlestick reversal pattern is stronger evidence, because something specific happened there. So a hammer low fifteen cents inside a zone stays a separate line, and the zone forms around it.
That one rule settles the argument you will have most often. When a pattern and a cluster disagree about where the line goes, the pattern wins.
When an obstacle has no pattern behind it on its own timeframe, drop down one timeframe and look again. A four-hour high with nothing behind it often turns out to be an engulfing pair on the hourly. Then you have your evidence and your line.
If nothing shows up on the lower chart either, you have an honest gap in the method. That obstacle is real, price did turn there, and there is no rule that says whether it earns a line. Left alone is the usual answer, and it is a judgment call rather than a rule.
Frequently asked questions
Wide enough to swallow levels that are too close to trade between, and no wider. On a large high-priced stock that is roughly a dollar, tighter on mid caps.
Wicks. The extreme of the pattern is the level, so support is the lowest low and resistance is the highest high. Bodies are only used to test whether a pattern is valid.
Then price is in a no-trade area until it holds above or below the box. Trade the edges after a close beyond one, and skip everything inside.
Compare your zones by symbol in TraderLog
TraderLog reports results per symbol from your Schwab or IBKR imports. A zone width that works on one name can be wrong on another. Replay each trade on a TradingView chart and the width is easy to judge.
Every trading morning at 8:40 ET our model draws the SPY, QQQ and IWM zones it expects to matter, on a TradingView chart, before the open. Where price reaches one, it has turned 74 percent of the time. Free, no account. See today's map