There is a price above which your setup stops paying
The stop and the target are set by the chart, not by you. That leaves the entry price as the only variable. There is a number past which the trade stops paying you to take it.
You hesitated for forty seconds and the trade changed
You watched the level, the candle closed the way you wanted, and you waited to be sure. By the time you clicked, price was a dollar higher. Same idea, same stop, same target, and a trade that no longer pays.
The geometry is what moved. Your stop sits under a level price picked. Your target sits at the next zone, which price also picked. Neither of them cares that you were slow.
So the only variable left is what you pay. Move it up and you spend risk to buy the same reward. Do that a few times a week and your win rate has to climb to keep you flat. Nobody can decide to raise their win rate.
Traders call this chasing, which makes it sound like a psychology problem. It has a number attached, and you can work the number out before the market opens.
Work out the latest price that still pays two to one
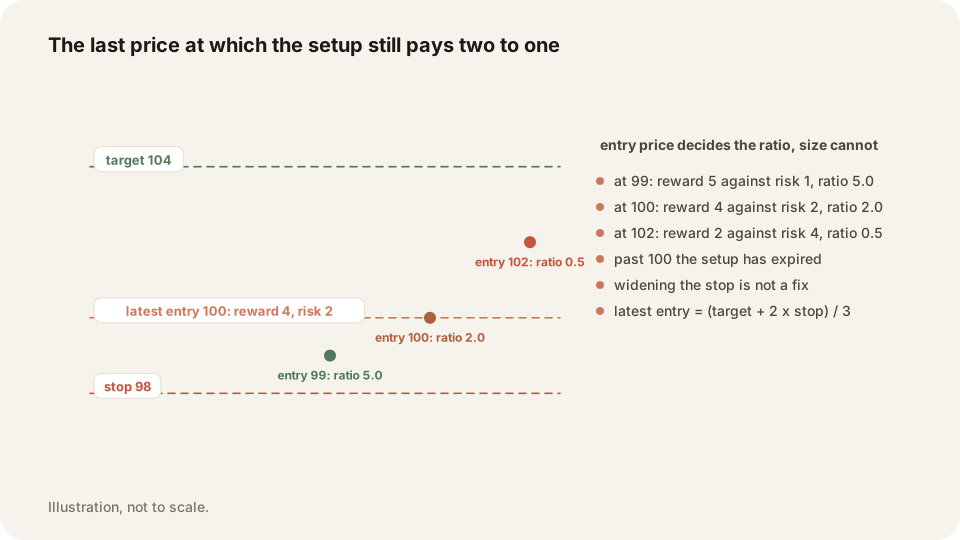
Take a stock trading at 100. The level under it puts your stop at 98, and the next zone above puts your target at 104. Enter at 100 and you are risking 2 to make 4. That is the 1:2 you wanted.
Now enter at 101. Your risk is 3 and your reward is 3. Same chart, same levels, and you are taking a coin flip with commissions attached.
The break point sits between the two, and you can solve for it. Reward has to be twice risk. So target minus entry has to be twice entry minus stop. Rearranged, the latest entry equals the target plus two times the stop, all divided by three.
For this trade: 104 plus 196 is 300, divided by 3 gives 100. Above 100 the setup has expired, the way a limit order expires. At 100.50 you are already down to 1.4 to 1.
What each ratio demands from your win rate
Each ratio sets the win rate you need to finish flat. That number climbs fast when you pay up.
At two to one you can be wrong two times out of three and break even. At one to one you have to be right half the time. Drop to three quarters of a unit of reward per unit of risk. Now you need close to six winners in ten, which is a different trading career.
These come from one line of arithmetic. Breakeven win rate is one divided by one plus the ratio. No study, no survey, nothing to argue with. They also ignore commissions and slippage, so treat every figure below as a floor.
The two answers traders reach for when they are late
The first is to take it anyway. You are already behind, the move looks strong, and one dollar seems small. The arithmetic above says you moved your breakeven from 33 percent to 50 percent for the privilege.
The second is worse. Widen the stop until the ratio looks acceptable again. Entry 101, stop dropped to 97, target still 104. Now you risk 4 to make 3, which is 0.75 to 1.
Your breakeven win rate is now over 57 percent, and the same share count doubles the dollar loss. Widening the stop moves the one number the chart handed you. The level is where the idea dies.
Put the stop somewhere the chart never marked and you no longer know what you are wrong about. There is a third answer nobody likes. Skip it, watch the move run without you, and mark the level for the retest.
Compute the expiry price before the market opens
Do this once per level while you are calm. For each zone on your list, write the stop, the target, and the latest entry. Three numbers per level takes about a minute. It removes the decision from the moment you are least able to make it.
Put the latest entry into the platform as an alert. When price is already past it the alert never fires. Arithmetic protected you instead of willpower.
The position tool on your charting software does the same job visually. Drag the stop to the level and the target to the next zone. Slide the entry up until the tool stops reading 2. That price is your line for the session.
One honest gap. None of this tells you the target is reachable, because the arithmetic only checks the geometry. Say the next zone is four dollars away and the stock rarely travels two in a session. A clean ratio is still a bad trade.
Frequently asked questions
Two to one, measured off the chart rather than guessed. At that ratio you break even winning a third of your trades, which leaves room for a normal losing week.
No. The stop marks where the idea is wrong and the chart set it. Widening it lowers the ratio and raises the dollar loss at the same time.
Set an alert at the latest entry price and wait for a pullback into it. If price never comes back, you skipped a trade that had stopped paying you.
Run the numbers on TraderLog's free calculators
The risk to reward calculator takes an entry, a stop and a target, then shows what the trade pays. The position size calculator turns that risk into a share count. Both are free on the site, no account needed.
Every trading morning at 8:40 ET our model draws the SPY, QQQ and IWM zones it expects to matter, on a TradingView chart, before the open. Where price reaches one, it has turned 74 percent of the time. Free, no account. See today's map