Your stop is sized for a 1-minute chart and your idea is hourly
You get the direction right, get stopped, then watch the trade work without you. Twice a day, most days. The gap between the chart you enter on and the chart your bias came from is doing it.
Right on direction, out of the trade anyway
You read the hourly, decide the day is going up, then drop to the 1-minute to time the entry. You get filled. Price wiggles down fifteen cents, your stop goes, and forty minutes later the hourly target prints without you.
Those fifteen cents are invisible on the hourly. Not even a wick up there. On the 1-minute they are six red candles. That is plenty to look like a reversal. It is also plenty to clear a stop parked under the last 1-minute low.
You are running two trades at once. The idea has an hourly life span and an hourly amount of noise inside it. The stop has a 1-minute one. Whichever runs out first decides the outcome, and the stop always gets there first.
Put the entry chart and the direction chart within reach
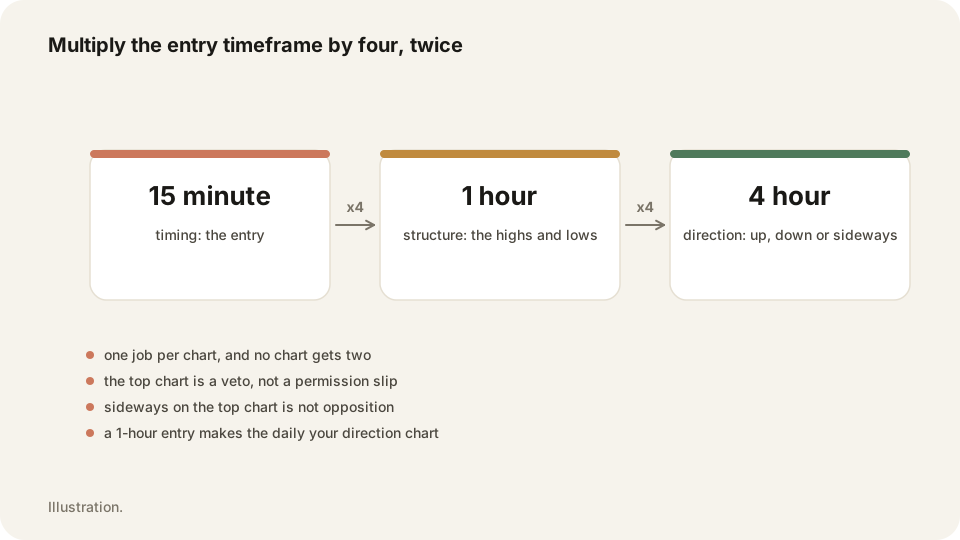
Start from the chart you actually click on. Multiply it by four for the chart that shows structure, then by four again for the chart that gives direction. Three charts.
Enter on the 1-minute and structure comes from the 5, direction from the 15. Enter on the 5 and you watch the 15, with the hourly behind it. Enter on the 15 and your direction chart is the 4-hour.
The hourly does not get banned from your screen. It stops being the thing that decides a trade whose stop is measured in 1-minute candles. Sixty to one is too far apart for those two charts to talk to each other. Anything the hourly calls a pullback is a full trend on the 1-minute.
Give the stop to the timeframe that owns the idea
A stop belongs to the chart your idea lives on. Hourly idea, hourly stop. That means a wider stop and fewer contracts, and both of those are the point.
Run it on a 100 stock. A 1-minute stop under the last swing might sit fifteen cents away. An ordinary hourly pullback runs sixty. That stop gets cleared four times over before the move you predicted has even started.
So size down instead of tightening up. If sixty cents of risk means one contract where fifteen cents bought you four, take the one contract. One position you can hold beats four you cannot. Then let a candle close beyond the level stop you out. A wick through it should not. That wick is what has been removing you.
Two other reasons the same thing keeps happening
Entry distance is the second cause. Buying the close of a big candle leaves your stop far below you. A routine retrace toward the level then reaches it. Wait for the pullback instead.
The third is a stop parked where everyone else parks theirs, a few cents under an obvious low. Clearing that shelf of orders is a normal part of a level being tested. It happens in both directions and it happens before the real move, which is exactly why it feels personal.
None of this comes with a number. Nobody has defined how deep a pullback goes before it counts as a reversal, and no chart will tell you. You are choosing how much noise you will pay for. Make that choice on purpose.
Rebuild your three charts before the next session
Ten minutes once, then a glance each morning. The output is a stop you can defend and a size that fits it.
- Write down the chart you genuinely enter on, not the one you would like to use.
- Multiply it by four for structure and by four again for direction.
- Round to a timeframe your platform offers when the number does not exist.
- Save those three as a layout so you stop rebuilding them daily.
- Measure a normal pullback on your direction chart in cents.
- Place your stop beyond that distance, at the level rather than at the last low.
- Cut position size until the wider stop risks the same dollars as before.
- Set the stop to trigger on a candle close beyond the level, not a wick.
- Delete the hourly from your bias if your stop is a 1-minute stop.
- Tag every trade with the timeframe you entered on.
- Review the stopped-out trades weekly and check which timeframe they came from.
Frequently asked questions
Most often the stop is sized for a much faster chart than the idea. A normal pullback on your direction chart is a full move on your entry chart.
Both, together. Widen the stop until it sits beyond the level. Then cut size until the dollar risk matches what it was before.
Look at it for context. Do not let it set the direction of a trade whose stop is fifteen cents away. Take direction from the 15-minute instead.
Let TraderLog's weekly report card keep score
TraderLog sums up each week: entries written, checklist score, sentiment and one suggestion. Alongside it, the stats page splits results by how long you held trades. If short holds against an hourly idea are costing you, that bucket says so.
Every trading morning at 8:40 ET our model draws the SPY, QQQ and IWM zones it expects to matter, on a TradingView chart, before the open. Where price reaches one, it has turned 74 percent of the time. Free, no account. See today's map