You hit the profit target and the payout still got refused
One good Tuesday made most of your gain, and the review caught it after you passed. The cap was in the terms the whole time, behind a percentage the dashboard never displayed. It is fixable, and the fix is arithmetic.
The consistency rule caps what one day can contribute
A consistency rule limits how much of your total profit may come from your single best trading day. Firms commonly set that cap somewhere in a 30 to 50 percent range. The exact figure differs between firms, and firms revise it. Open your current terms and find yours before reading further.
The reason it exists is reasonable. One enormous session proves nothing about an edge. A firm sees an account where one day produced most of the gain. That looks like a coin flip that came up right.
What hurts is when the rule gets applied. Nothing blocks the trade while you are placing it. You clear the profit target, request the payout, and the review runs then, comparing your best day against your total. The percentage becomes real at the exact moment it costs you money.
Your best day sets the total profit you need
One division tells you where you stand: best day divided by the cap.
Say your best day made 1,200 and the cap is 40 percent. Divide 1,200 by 0.40 and you get 3,000. Until total profit reaches 3,000, that day is more than 40 percent of it. The account cannot pass or pay out. Tighten the cap to 30 percent and the same day now demands 4,000.
Read it the other way and it becomes a warning about outsized sessions. A 2,000 day under a 40 percent cap has just committed you to grinding out 5,000 before anything gets paid. That is 3,000 of extra work bought with one good morning, and no trade you take afterwards removes it. Run the division after every green day and the number stops ambushing you at the payout window.
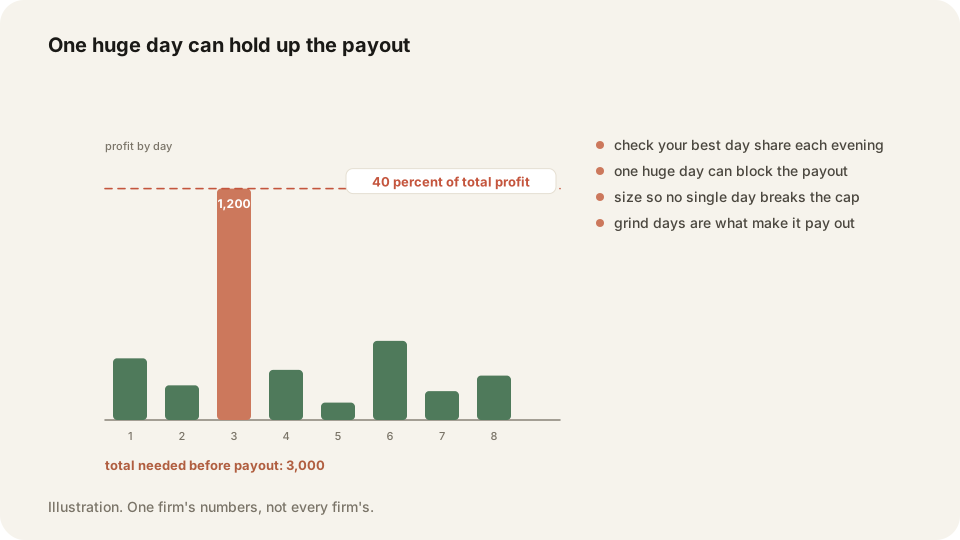
Check your best day share every evening
Track the ratio nightly, in the same sitting where you log the trades. You need two numbers: your best day so far in the current period, and your running total profit. Divide the first by the second and write the answer down.
That percentage is your real distance from a payout, and it moves on days you barely traded. A flat day leaves it alone. A small green day pulls it down. A big green day pushes it up, which is the part nobody expects and the part that ends evaluations.
Reset the calculation when the period resets. Evaluation and funded phases are often measured separately. A spike in the evaluation may not follow you into the payout window. Check which periods your firm measures, because that detail decides whether an old monster day still counts against you.
Size so no single day can breach the cap
Work backwards from the cap to a daily profit ceiling. If your target is 6,000 and the cap is 40 percent, no day may finish above 2,400. That is enforceable: when the day reaches the ceiling, flatten and stop.
The usual breach is the opposite behaviour. A trend day starts paying. You size up because it is working. By the close, one session has made 3,100 of a 6,000 goal. You now need 7,750 in total, and the day you cannot repeat is the reason.
So keep starting size fixed. If you trade two contracts normally, do not go to eight because the tape is friendly. Add on structure and keep the add small. A good day trimmed to a merely good day costs you far less than a refused payout.
What to do when you have already breached the cap
Add ordinary days. The best day is fixed history, and the total is the only side of the fraction you can still move.
That makes the job clear and boring. Trade your normal size, take the setups you always take, and let small green days grow the denominator. With a 1,500 best day and a 40 percent cap, you need 3,750 total. From 2,000 that is 1,750 of routine profit away. At 250 a day that is seven sessions.
The trap is deciding to close that gap fast. Sizing up creates a new best day, which raises the requirement again, and the fraction runs away from you. Chasing the number is how a breach that needed two patient weeks turns into a blown account.
Run this check before you request a payout
Five minutes after the close, in the same sitting as your journal entry.
- Open your firm's current terms and write down the exact consistency percentage.
- Confirm whether the cap is measured on the evaluation, the payout period, or both.
- Record your best single day of profit in the current period.
- Record your running total profit for that same period.
- Divide the best day by the total and log the percentage in your journal.
- Divide your best day by the cap to get the total profit you still need.
- Set a daily profit ceiling equal to the cap times your profit target.
- Flatten and stop trading on any day that reaches that ceiling.
- Keep your starting size fixed and add only when structure confirms the move.
- After a breach, trade normal size until the ratio falls back under the cap.
Frequently asked questions
Commonly somewhere in a 30 to 50 percent range of total profit from one day. It varies by firm, and firms change it. Read your own current terms rather than a forum post from last year.
Usually yes, by growing total profit until your best day falls back under the cap. Nothing erases the big day, so more ordinary profit is the only lever you have.
Some firms run a matching rule on the loss side, and separate daily loss limits are close to universal. Check whether yours measures best day, worst day, or both.
Watch your best and worst days in TraderLog
The stats page reports your best day and your worst day next to profit factor and expectancy. The calendar shows every day's P&L in one grid, so a single outsized day is easy to spot. Trades import from Schwab, IBKR or a CSV.
Every trading morning at 8:40 ET our model draws the SPY, QQQ and IWM zones it expects to matter, on a TradingView chart, before the open. Where price reaches one, it has turned 74 percent of the time. Free, no account. See today's map