The line you just broke is the best buy level on your chart
You broke resistance, deleted the line, and bought a dollar and a half higher. Then price came back to the level you erased and stopped you out. The flip has an order to it, and skipping steps is what costs money.
Deleting a broken resistance line throws away your best entry
Resistance breaks and the line looks finished. It has only changed jobs.
A price the market defended once is a price the market has opinions about. When buyers finally close above it, the sellers defending it are trapped on the wrong side. Their covering is part of what holds the level on the way back down.
So the level keeps working, with the instruction reversed. It sold while price was underneath. It buys once price is above and holding. Erasing it leaves you with a chart full of open space and nothing to enter against.
The practical damage shows up as chasing. With the line gone, your only reference is the current price. So you buy strength wherever you happen to be looking. Then the pullback arrives and hits the level you deleted. It takes your stop, then does exactly what you predicted.
A close beyond the level flips its role, and a wick does not
The break is a close, on the timeframe that drew the level. Everything else is noise dressed up as a signal.
A wick above resistance is the market checking for orders. It goes up, finds sellers, and comes back. That is normal behaviour at any level worth drawing. Treat it as a break and you buy the high of the day.
Use the timeframe that produced the line. A resistance drawn from a daily shooting star flips on a daily close, not on a five-minute close through it. A level from an hourly engulfing pair flips on an hourly close. Match them and the rule stops being ambiguous.
Gap boxes flip the same way, with one extra step. A falling window closes only on a close beyond the box on its own timeframe or higher. The whole box, not half of it.
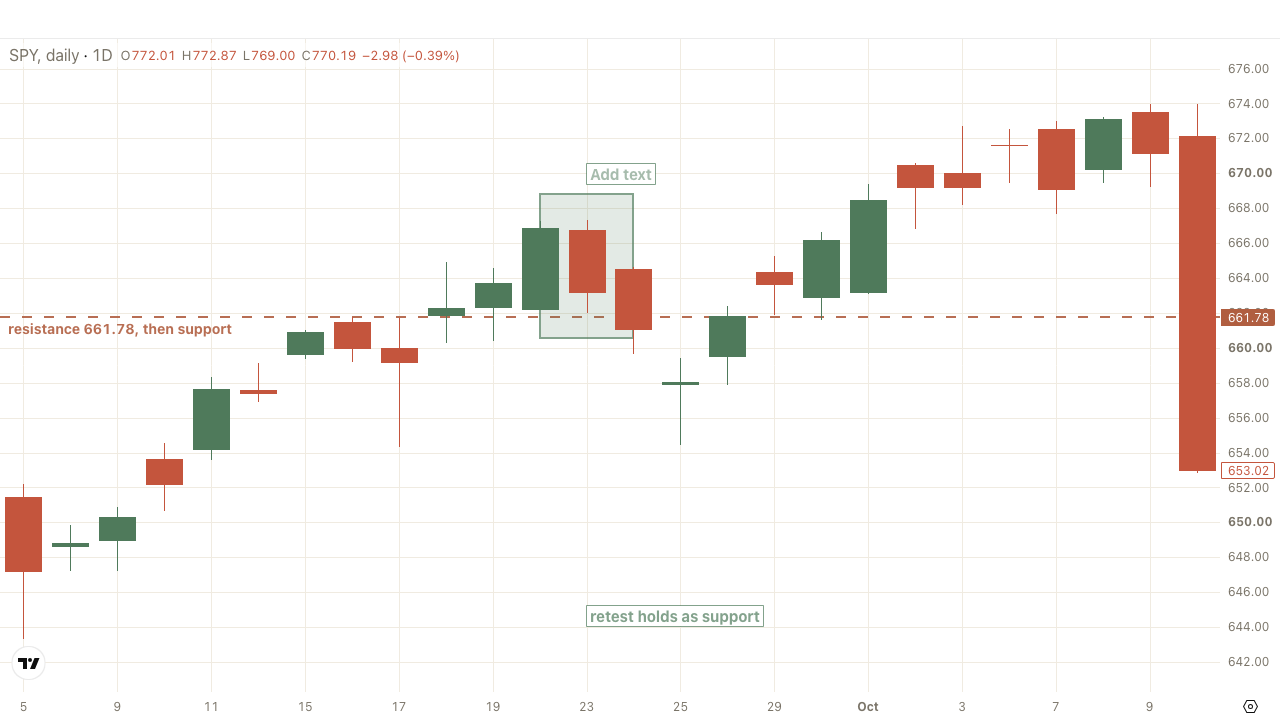
The sequence: close beyond, hold, retest, enter near the level
Work an example. Resistance sits as a box between 99.80 and 100.20. Price closes the day at 101.00, so the level has flipped. Now you wait.
Price pulls back to 100.30 over the next session and refuses to close back inside the box. That is your entry. Your stop goes on a close below 99.80, the far edge, which puts about 0.50 at risk. The next marked resistance is at 102.30, so the reward is 2.00. That reads four to one.
Now chase instead. You buy the strength at 101.60 with the same stop and the same target. Risk is 1.80, reward is 0.70. The setup pays less than half of one to one and you have taken the identical idea.
Same chart, same thesis, opposite outcome. The difference is the distance between your entry and the level. Exactly one price exists above which the trade stops paying.
Delete the flipped level once it has been tested
A flipped level gets one job. Price comes back, the level holds or it fails, and either way the information has been spent.
After that test the line is history. Keep it and it will still be on your chart three weeks later. By then it is arguing for a trade it cannot support. Delete it and redraw from the current price.
The same goes for a gap box that has closed, flipped, and been retested. While the box was open it was a single item and the far edge was the strongest part of it. Once it has flipped and been tested, it comes off the chart.
This matters because of the six level cap. Every stale line burns one of your six slots. That slot is spent on a price nobody argues about anymore.
The flip checklist, in the order it happens
Eleven steps. If you cannot tick one, you are earlier in the sequence than you thought.
- Identify the timeframe that produced the resistance line
- Wait for a candle to close above it on that timeframe
- Redraw the line as support instead of deleting it
- Ignore the first push higher, it is not your entry
- Wait for price to pull back toward the level
- Check that price does not close back inside the old zone
- Enter as close to the level as the pullback allows
- Set the stop on a close below the far edge of the level
- Measure reward to the next marked resistance, not to a round number
- Skip the trade if that measurement is under two to one
- Delete the level once the retest has resolved either way
Frequently asked questions
Wait for a close above the level on its own timeframe, then wait for the pullback. Enter near the level and stop out on a close back inside it.
No. A wick through the level is the market hunting orders and it flips nothing. Only a candle close beyond the level changes its role.
Then there is no entry and you let the trade go. Delete the line when you rebuild the chart and work with the levels price is actually near.
Measure your flip entries in TraderLog replay
Each imported trade goes back on a TradingView chart with your fill marked. The distance between your entry and the flipped level is right there. TraderLog's stats then say what your average winner and loser look like.
Every trading morning at 8:40 ET our model draws the SPY, QQQ and IWM zones it expects to matter, on a TradingView chart, before the open. Where price reaches one, it has turned 74 percent of the time. Free, no account. See today's map