Three charts, one job each, and the top one holds a veto
You checked four timeframes, they disagreed, and you took the trade anyway. The rule was never about how many charts you open. It tells you which charts to open and what each one is allowed to decide.
Opening four charts gives you four opinions
Put the 1-minute, 5-minute, 15-minute and hourly on screen together and you get four votes. Two of them will agree with the trade you already wanted, so you take it and call that confirmation.
The rule people quote as the rule of four is arithmetic. You start from the timeframe you enter on and multiply. The four-charts version came from hearing the number and counting windows. It hands you a screen where something is always disagreeing.
The cost shows up as hesitation. You see a hammer on the 5-minute, glance at the 1-minute, watch it wobble, and skip the entry. Price runs without you, and you chase it two candles late. The 1-minute never had a vote on direction, but you gave it one anyway.
Multiply your entry timeframe by four, twice
Start with the chart you actually enter on. Multiply by four to get the chart that shows structure. Multiply by four again for the chart that gives you direction.
A 15-minute entry gives you the 1-hour for structure and the 4-hour for direction. A 1-hour entry gives you the 4-hour and the daily. A 5-minute entry asks for a 20-minute chart, which most platforms skip. Use the 15 or the 30, then the 1-hour or the 2-hour. The point of the multiplication is to pick charts far enough apart that they can say different things. Charts one step apart, the 5-minute and the 10-minute say, mostly repeat each other.
Three charts. That is the entire set. If a fourth chart would change your mind, the plan is the problem.
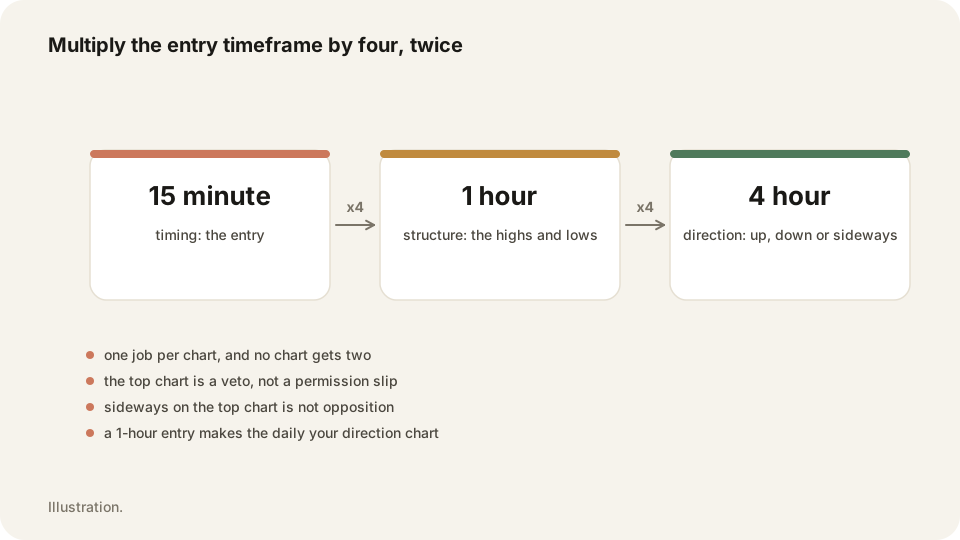
One job per chart, and no chart gets two
The highest chart answers one question. Up, down, or sideways. You are not hunting entries there and you are not reading its candles for timing.
The middle chart gives you structure. Where the swing highs and lows sit. Which one price is working toward. Whether the last swing low is still intact. Your levels live on this chart.
The lowest chart is timing. It tells you when to click, and that is the only thing it is qualified to say. The moment the 5-minute starts telling you the trend has changed, stop. That chart has taken a job that belongs two levels up. That swap is what turns a planned trade into an improvised one, usually about ten minutes before it stops working.
The top chart is a veto, and sideways is not a no
Direction from the highest chart works as a veto rather than a permission slip. A 4-hour uptrend does not mean take every long you see. It means do not take shorts today.
Sideways is the case people get wrong. A flat higher timeframe is not against you. The veto is switched off. You can trade the levels inside the range in both directions, which is often the cleanest setup available.
Volume separates a real reaction from a shrug. Price reaches your level, turns on nothing much, and you have a suggestion rather than a signal. You can still take it. Size it like a suggestion. Nobody has ever put a number on how much volume is enough, so that call stays yours.
Counter-trend trades, and the version of the rule people really use
You can trade against the higher timeframe. Two conditions. Price has to be at a level you already drew. The decision gets made before you are in, never mid-candle. Going counter-trend because a pattern appeared in open space is how accounts get small.
Now the tension nobody mentions. Read strictly, all three charts agreeing is rare, and you would take a handful of trades a month. Read loosely, the rule is do not fight the highest chart. That looser version is the one almost everyone trades. Pick one on purpose and write it down. Switching between them after the fact is how a rule stops meaning anything.
Options traders carry an extra clock. Early and right costs the same as wrong while theta runs. Agreement across charts is partly a way of buying less waiting.
Set your three charts before the open
Ten minutes on a Sunday, then two minutes a morning. The output is one word of direction and a sentence you can read back to yourself at 10:30.
- Write down the timeframe you actually enter on, not the one you stare at.
- Multiply it by four for structure and by four again for direction.
- Round to a timeframe your platform offers when the number does not exist.
- Save the three charts as a layout so you stop rebuilding them every morning.
- Mark direction on the highest chart in one word: up, down or sideways.
- Draw your levels on the middle chart and leave the lowest one clean.
- Write today's veto as a sentence, such as no shorts while the 4-hour holds up.
- Check volume on the reaction candle before you accept any level.
- Decide before the open whether a counter-trend trade is allowed today.
- For short-dated options, set how long the trade may sit doing nothing.
- Log which chart you traded with and which one you traded against.
Frequently asked questions
A way to pick charts. Multiply the timeframe you enter on by four for structure, then by four again for direction. Three charts, chosen by arithmetic instead of habit.
Strictly applied, that lines up rarely and you would barely trade. The workable version is that you never trade against the highest chart. Sideways up there does not count as against.
Twenty minutes does not exist on most platforms. Use the 15 or 30 for structure, then the 1-hour or 2-hour for direction. Far enough apart to disagree is what matters.
Note the three charts in TraderLog
Write the direction you read from the higher chart in that day's entry, before the open. The pre-session checklist has a fixed item for key levels identified. At the close, the calendar puts the day's P&L beside what you wrote.
Every trading morning at 8:40 ET our model draws the SPY, QQQ and IWM zones it expects to matter, on a TradingView chart, before the open. Where price reaches one, it has turned 74 percent of the time. Free, no account. See today's map