A line through the middle of a candle protects nothing
You draw support at a cluster of closes. Price dips twenty cents under it, takes you out, then closes back above. That was not a stop hunt aimed at you. The line was in the wrong place, and there is a rule that stops it happening again.
Half the candle is already trading below your line
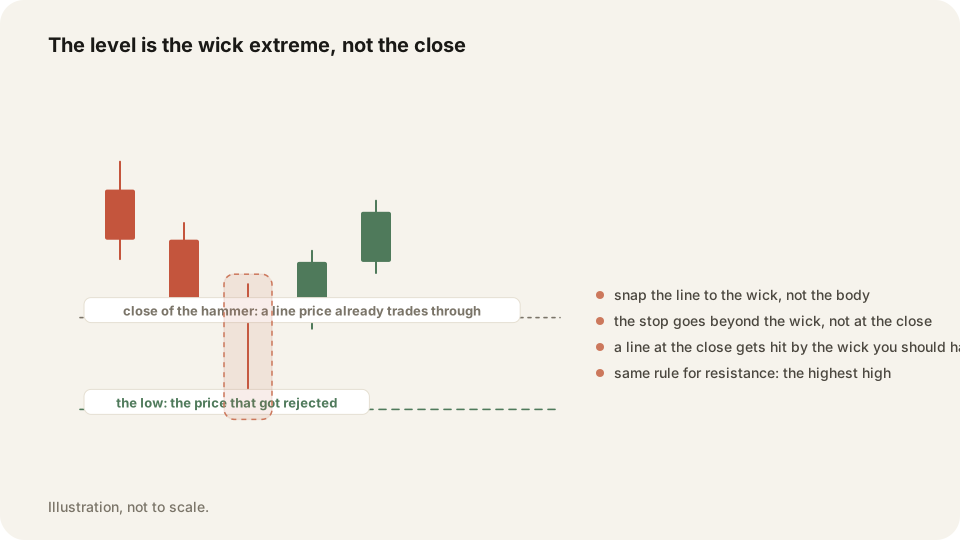
Draw support at a close and look at what sits underneath it. Wicks. Sometimes twenty or thirty cents of them, on candle after candle.
That space is not unknown territory. Price went there, traded there, and came back. Put a stop under a line with price action below it and you are paying for known ground. The market covered it already.
The result feels personal. You get taken out on a spike and the candle closes green, well above where you were sitting. Traders call this a stop hunt, and there is a real liquidity grab behind moves like that. Your line just handed it an easy target. Move the line and most of those hits disappear without changing anything about your patience.
Snap every line to the extreme so it cuts no candle
The test is visual and takes a second. If your line passes through a candle, body or wick, it is in the wrong place. Move it down to the lowest low of the pattern, or up to the highest high for resistance.
This holds for a hammer, an engulfing pair, a morning star or a plain candle high. Any level you marked while walking backwards gets the same treatment. The extreme is the price where the move actually stopped. The close is where it happened to be when a clock ticked over.
One consequence surprises people. Lines drawn this way sit further from current price than the ones you had before. That is the point. A level you can be shaken out of by half a candle was never protecting the trade.
What the correct line does to your stop, in numbers
Take a pattern whose closes cluster at 100.40 and whose lowest wick is 100.10. Next obstacle above is a prior high at 100.80.
Drawn at the close, the level reads 100.40. You buy at 100.45 and put the stop just under 100.40. Five cents of room, in a stock that wicks thirty. You get hit and the trade you were right about continues without you.
Drawn at the wick, the level reads 100.10. Enter near it, at 100.20, and you are wrong if price closes below 100.10. Risk is about ten cents, reward to 100.80 is sixty. That geometry pays six to one before costs.
The same arithmetic explains why chasing fails. Enter the identical idea at 100.55 and you are risking forty five cents to make twenty five. Nothing changed except your entry price, and the trade stopped being worth taking.
The one level with no wick to snap to
Gaps break the rule, and they have to. When price jumps from one candle to the next, no trade happened in the space between them. There is no extreme to snap to, because there is nothing there.
So a gap gets drawn as a box instead of a line. Anchor the rectangle to the two candles that made the gap, wick to wick. Then extend it to the right. While it stays open, the whole box acts as the level. The far edge is the strongest part. On an up gap the far edge is the bottom of the box. A pullback into it is where the trade sits.
Everything else on your chart is a line. The box is the single exception, which makes it easy to remember.
Drawing at the wick only pays if you exit on a close
Correct lines and wick based stops fight each other. A level at the extreme is only useful if a poke below it does not end the trade.
So the exit trigger becomes a candle closing beyond the level, read on the timeframe you entered on. A wick through and back is the market taking liquidity before it moves. The close is the market telling you the idea is wrong.
This costs something and it is worth saying plainly. When you are genuinely wrong, waiting for the close costs more. The loss is bigger than a tight stop would have been. You are trading a handful of larger losses for a lot fewer shakeouts. Size the position so the close based loss is one you can take without flinching. You will take it sometimes.
Frequently asked questions
At the wick. Support is the lowest low of the pattern and resistance is the highest high. The line then passes through no candle.
Usually the level sits at a cluster of closes with wicks hanging below it. Redraw at the extreme and trigger the exit on a candle close beyond the line rather than a touch.
Yes. Resistance goes at the highest high of the pattern, wick included. A short is wrong when a candle closes above it, never when a spike tags it.
Tick key levels on TraderLog's daily checklist
TraderLog's pre-session checklist includes key levels identified and risk rules followed. Tick them before the open and your adherence score lands on the calendar beside the result. A month of that shows whether the drawing work paid.
Every trading morning at 8:40 ET our model draws the SPY, QQQ and IWM zones it expects to matter, on a TradingView chart, before the open. Where price reaches one, it has turned 74 percent of the time. Free, no account. See today's map