Six levels in total, counted across every chart you use
Your chart has fourteen lines on it and price is always near one of them. So every trade looks justified and none of them are filtered. A hard cap fixes that in ten minutes a night.
A crowded chart approves every trade you already wanted
Draw enough lines and price is always at a level. That is the trap. Fourteen lines on an hourly chart means no candle ever sits in open space. So the chart agrees with you, whatever you were going to click.
The crowding comes from two habits. The first is drawing from the far left of the chart, collecting touch points price cleared months ago. The second is drawing the same area three times over. It showed up on the daily, the four hour and the hour.
Old touch points are also the prices everyone else drew. Orders pile up there and get run through on the way somewhere else. A level price cleared and never came back to is doing nothing for you today.
The fix is a hard cap on how many lines you are allowed to keep. Six. That number does the filtering your discretion has been failing to do at nine in the morning.
Keep three supports and three resistances across all three charts
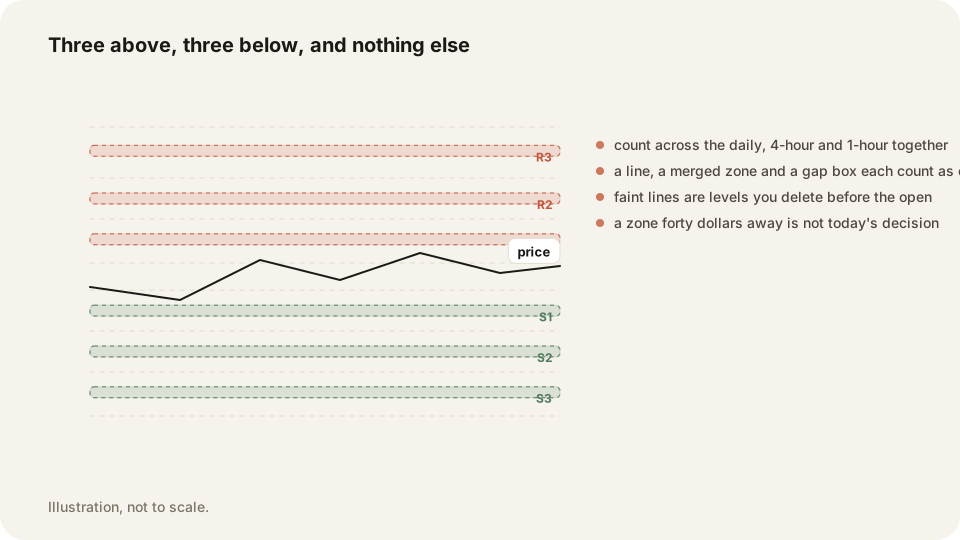
Three above price, three below, and that is the finished chart. The count is a total across the daily, the four hour and the one hour together. Not three per timeframe. Six lines in all.
One obstacle is one item however it was drawn. A single line taken from a hammer low counts as one. A merged zone built from four clustered highs counts as one. A gap box counts as one, both edges included.
The six you keep are the six nearest to price. You are marking obstacles, and an obstacle twenty dollars away is not in the way of today's trade. When price clears the nearest resistance, that line is spent and the next one up moves into the set.
This also settles the timeframe argument before it starts. If the daily and the hourly both mark the same area, you have one level, not two. Draw it once and note that two charts agreed.
The cap turns your levels into a filter instead of a rubber stamp
With six places on the chart, a setup either happens at one of them or it does not happen. That is the whole benefit.
A reversal pattern printing in open space becomes an automatic pass. You will sit out trades that would have looked fine on a crowded chart. Some of them will run without you. That is the cost of the rule, and it is cheaper than the alternative.
The cap also keeps your reward arithmetic honest. Say you enter at 100 with your stop at 99.40. You are risking 0.60, so you need 1.20 of clear room above to pay two to one.
Six clean levels answer that in one glance. Fourteen lines answer nothing, because something is always sitting in the way of the target. A chart you cannot read quickly is a chart that will talk you into the wrong trade.
Wipe the chart at night and walk it again from the new price
Delete every level after the close and rebuild from scratch. It takes about ten minutes and it stops stale lines from following you around for weeks.
Rebuilding forces you to start at the current candle and work backwards. Yesterday's chart was drawn from yesterday's price, so its nearest obstacles are not the ones in front of you now. Anything still relevant gets redrawn in seconds, and that is the test it has to pass.
Three deletions are permanent. Lines swallowed inside a merged zone go, because the zone replaced them. A gap box that price closed beyond, flipped, and then retested goes, since it has done its work.
And any level price has already run through and left far behind goes with them. Keeping it because it once mattered is how a six line chart becomes a fourteen line chart by Thursday.
Rebuild your levels in ten minutes after the close
Same order every night, one chart at a time. Daily first, then the four hour, then the hour. Regular session data only, unless you trade futures.
- Zoom in on the current price until it fills the screen
- Turn off every indicator before you draw anything
- Start at the newest candle and work backwards, candle by candle
- Mark only the extremes of a reversal pattern or a gap
- Snap each line to the wick, never through a candle body
- Draw gaps as boxes anchored wick to wick
- Merge levels sitting within the merge distance for that price
- Delete every line you buried inside a merged zone
- Stop at three supports and three resistances in total
- Review the finished chart once an hour while you trade
Frequently asked questions
Three supports and three resistances, counted across the daily, four hour and one hour together. Keep the six nearest price and delete everything else.
One. The box is a single item and you trade its edges. Once price closes beyond it and comes back to test it, delete the box.
You are out of marked obstacles, so you stop trading that direction until you redraw. Walk the chart back from the new price and pick up the next three.
Compare your six with the Morning Map
The Morning Map publishes the model's support and resistance zones for SPY, QQQ and IWM before the open. It is free, as a page and as a daily 8:40 ET email. Draw your own six first, then check them against it.
Every trading morning at 8:40 ET our model draws the SPY, QQQ and IWM zones it expects to matter, on a TradingView chart, before the open. Where price reaches one, it has turned 74 percent of the time. Free, no account. See today's map