An open gap is a level with a top and a bottom
You marked a gap with one line and price keeps turning somewhere else inside it. The gap is a range, and the whole range is the level. This covers how to draw it, which way it works, and what to do when price closes through.
One line across a gap puts your stop in the wrong place
A gap is a range with a top and a bottom. A line through the middle of it guesses at which edge matters. Price stops at the other edge often enough that a stop measured off the line gets clipped for nothing.
Watch a stock that gapped up two weeks ago come back to it. Sometimes the pullback stalls at the near edge of the gap. Sometimes it runs to the far edge and turns there. Sometimes it works through the whole thing and keeps going. All three are ordinary, and a single line describes none of them.
A rectangle covers all three. You get one edge to enter against and another to put a stop beyond. Plus a clean rule for when the level is finished.
Draw the box between the two candles
An up gap, also called a rising window, works like this. The low of one candle sits above the high of the candle before it. The box runs from that previous high up to the new low. Nothing traded in between, and the empty space is the reason the level exists at all.
A down gap, a falling window, is the mirror. The high of the new candle sits below the low of the one before it. The box runs between those two prices.
Draw it as a rectangle and extend it to the right edge of the chart. Set the chart to regular trading hours first. With extended hours switched on, the overnight session paints across the empty space. The gap everyone else has marked never shows up on your chart.
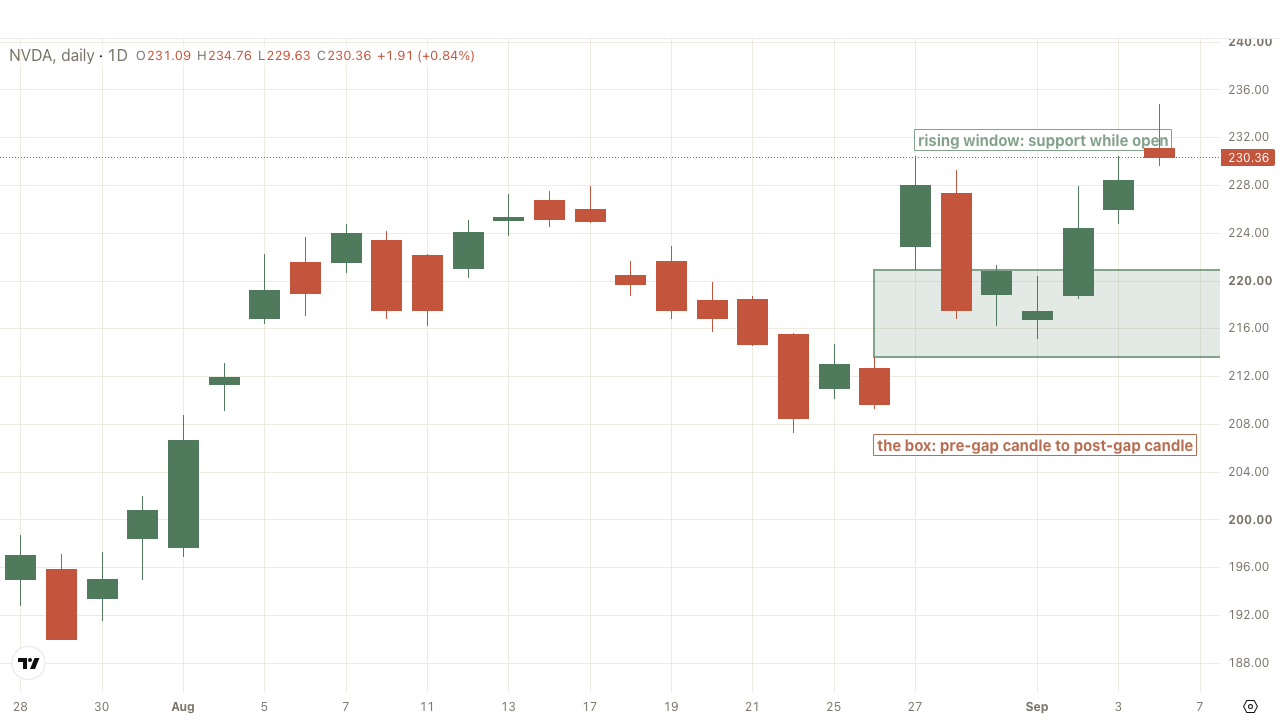
An open up gap holds price up, an open down gap holds it down
While an up gap stays open, treat the box as support. Price falling back into it tends to find buyers. Everyone who missed the move up is watching that same rectangle for a second entry.
A down gap works the other way. While it stays open the box is resistance, and rallies into it are where sellers come back.
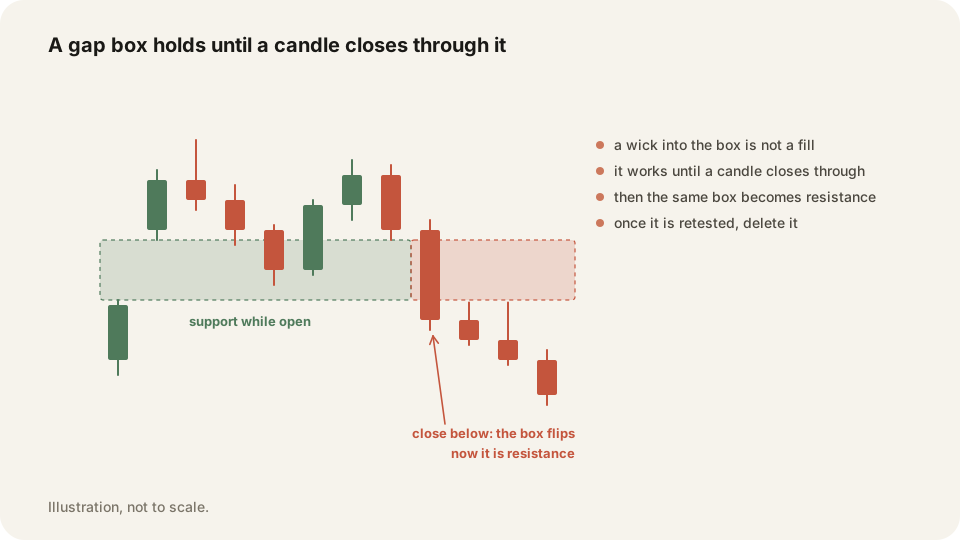
Open means no candle has closed beyond the far edge since the gap printed. Wicks into the box change nothing. A close inside the box changes nothing either. What ends it is a candle closing past the far side, measured on the timeframe you drew the gap on. A daily gap needs a daily close, and an hourly close through it does not count.
A close beyond the box turns the box around
Once a candle closes below the bottom of an up gap, that box stops being support. It becomes resistance, and the next rally into it is a place to sell rather than a place to buy. Broken resistance flips the same way in reverse.
Use the close for this, never the wick. A wick through the box is price checking whether anyone is there. That is the exact move most likely to take your stop before the level does its job.
So the box does not get deleted when it breaks. Keep the rectangle and change what you do with it. A gap from three weeks ago that price has closed below is a good place to hunt shorts. The traders who bought that edge on the way down are underwater right there.
Merge the box with what sits beside it, and know what a fill means
Gaps rarely sit alone. Say a hammer from last month left an extreme within about a dollar of your gap edge. On a stock trading in the hundreds, that is one zone. Widen the rectangle to cover both and stop tracking them separately. Scale the merge distance with the share price.
A filled gap means price has traded back through the entire box, edge to edge. The empty space is gone, so the thing that made the level special has gone with it. A gap with any untouched space left is still open and still works.
After a full fill, the box drops to being an ordinary zone. Keep it if the candles around it defend the area anyway. Delete it if the gap was the only thing it had.
Marking gaps in a weekend review
Run this on the daily chart for every symbol you swing. Twenty minutes across a short watchlist, and it holds for the week unless something gaps again.
- Set the chart to regular trading hours before you go looking for gaps.
- Start at the current price on the daily and work left, candle by candle.
- Mark every candle whose low sits above the previous high, or high below the previous low.
- Draw a rectangle from the earlier candle's extreme to the later candle's extreme.
- Extend each rectangle to the right edge of the chart.
- Label up gaps as support and down gaps as resistance.
- Check whether a daily candle has already closed beyond the far edge of each box.
- Flip the label on every box price has closed through.
- Merge any box within about a dollar of a pattern level into one wider zone.
- Delete fully filled boxes unless nearby candles defend the same area.
- Keep the three nearest zones above price and the three nearest below.
Frequently asked questions
No rule says they have to, and plenty stay open for months. Trade the box while it is open. Stop treating it as support once a candle closes through the far edge.
Use regular hours. With extended hours switched on, the overnight session paints across the empty space. A gap other traders have marked will not appear on your chart.
There is no number for it. The space has to be visible between the two candles at the zoom you actually trade. If you need to zoom in to find it, it will not hold much.
Compare your boxes to the Morning Map
The Morning Map posts support and resistance zones for SPY, QQQ and IWM before the open, free. Draw your gap boxes on your own chart, then see where the model put its zones. The email arrives at 8:40 ET.
Every trading morning at 8:40 ET our model draws the SPY, QQQ and IWM zones it expects to matter, on a TradingView chart, before the open. Where price reaches one, it has turned 74 percent of the time. Free, no account. See today's map