A wick into the gap is not a fill
Price dips into the gap on a five minute chart and you erase the box. Two days later the daily gap is still the level everything reacts to. It is no longer on your chart. One test fixes this.
Filled, tagged and half filled get used interchangeably
Three different events hide behind the word filled. Price touched the edge of the gap. Price traded some distance into it. Price closed all the way through and out the other side.
Only the third one ends the gap, and the first two get treated as if they did. So the box comes off the chart while it is still the strongest level around. The next reaction then happens somewhere you have nothing marked.
The other version of this is worse, because it looks like diligence. Price trades into the box, so you shorten the box to where price stopped. Do that for a week and the level has drifted forty cents from where the gap actually was. Now you are trading a line that exists on no other trader's chart.
The test is a close beyond the box, on the gap's own timeframe
A gap closes when a candle closes past it on the timeframe that created it, or on a higher one. A daily gap needs a daily close. A one hour gap needs an hourly close, and a daily close would settle it too.
The timeframe part is what people skip. A five minute candle closing inside a daily window means nothing. That window was drawn from daily candles. Watching intraday bars poke around inside it will talk you out of a level that is still doing its job.
Work it through. A rising window runs from 100.00 to 101.00 on the daily chart, and price is trading at 101.60. Tuesday it dips to 100.20 and closes at 101.30. The window is open. Wednesday it closes at 99.70, below the whole box. Now the window is closed, and only now.
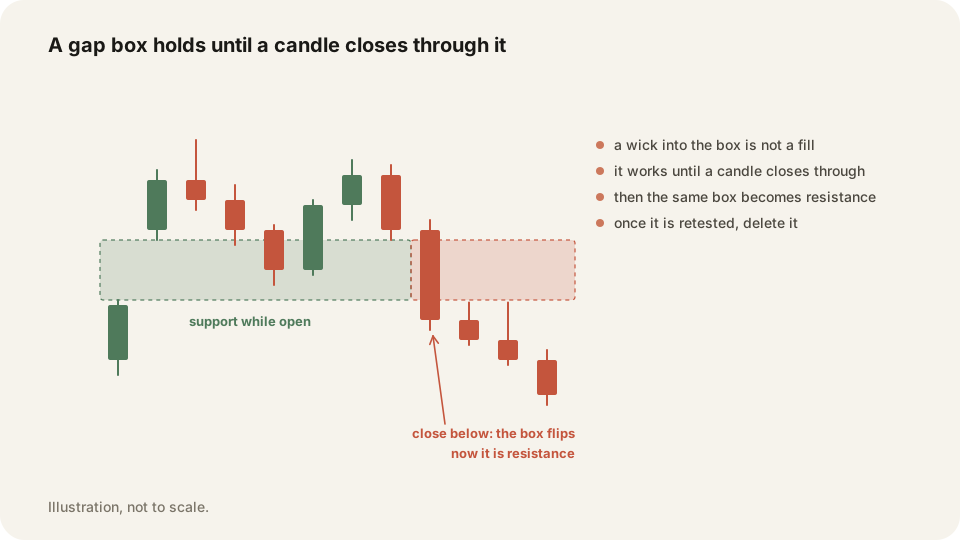
The box keeps its original size until then
Anchor the rectangle to the two candles that made the gap and leave it alone. Top edge, bottom edge, extended to the right. It stays that size for its whole life.
While the window is open, the entire box is support for a rising window, or resistance for a falling one. The far edge is the strongest part. On a gap from 100.00 to 101.00, the price that matters on a pullback is 100.00. That is the bottom of the box.
That is also where the trade lives. Entering at 100.90 because price entered the box gives you a stop below 100.00 and a dollar of risk. Waiting for the far edge gives you the same idea with a fraction of the risk. Shrinking the box removes the far edge and takes that entry away from you.
What the box becomes once it does close
It flips. A rising window that price has closed below stops being support and starts being resistance. A falling window closed through from below does the reverse.
At that moment the box turns into two ordinary levels: the top edge and the bottom edge. Trade them the way you trade any other line, with a close beyond them as the trigger. The rectangle has done its job. Price coming back from below meets the near edge first, so that is your first resistance.
Then delete them after the first retest. A flipped edge that price came back to and dealt with is history. Carrying it forward puts old prices on a chart you rebuild anyway. If the level never gets retested, it comes off with the rest of yesterday's drawing when you start fresh.
An open gap below is a destination with no timetable
Open windows attract price, which makes them useful as targets. A reversal starting above an unfilled window gives you a place to aim at. The far edge is the natural exit.
Two honest limits go with that. Nothing tells you when, and nothing promises it happens at all. Some windows stay open for months. Treating a fill as inevitable is how people hold a losing option through expiry.
The second limit is about scale. A reversal is usually a pause inside a bigger move rather than a full round trip. Target the nearest obstacle, take partials into it, and let a small remainder run if the move keeps going. Aim at a gap four dollars away because it exists and you give back a good trade. Price was never headed there today.
Frequently asked questions
When a candle closes beyond the whole gap on the timeframe that created it or a higher one. Trading into the gap without closing past it leaves the gap open.
No. A wick into the box shows price testing the level and getting pushed back. That is the level doing its job. Only a close through settles it.
There is no rule that says so, and some windows stay open for a long time. Use an open gap as a target you can take partials into, never as an outcome you can count on.
Look at the gap again in TraderLog
Each Schwab or IBKR fill arrives in TraderLog with a chart behind it. Replay the trade and see whether price closed through the gap or only wicked in. Write the call in the day's journal entry.
Every trading morning at 8:40 ET our model draws the SPY, QQQ and IWM zones it expects to matter, on a TradingView chart, before the open. Where price reaches one, it has turned 74 percent of the time. Free, no account. See today's map