The first line you draw is usually the one that costs you
You mark support at the obvious low, then price turns forty cents above it and hands back the profit. The level that mattered sat closer, and you walked straight past it. The fix is an order of operations, and it takes about ten minutes.
Your eye goes to the obvious low and skips everything closer
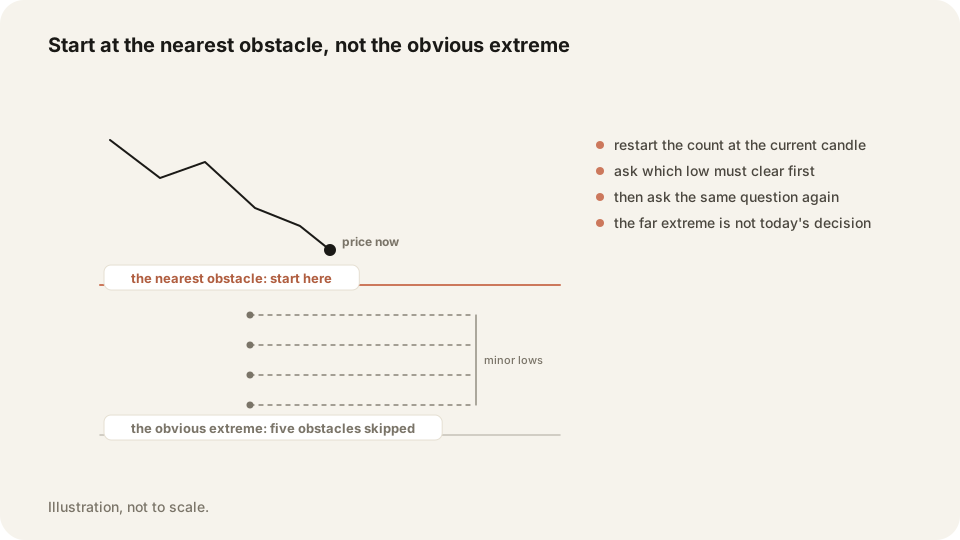
The first level people draw is the deepest low on the screen. It is the easiest thing to see, so the cursor goes there. Between that low and current price sit four or five highs and lows that price has to get through first.
Those skipped obstacles are where trades actually turn. You watch an open profit come back to nothing, and there is no line on the chart that explains it. So the loss gets filed under patience, or nerves, or bad luck.
It was a drawing problem. Price stopped somewhere real that you had never marked. Your entry was fine and your hold was fine. A missing line looks exactly like a discipline problem from the inside. So people spend months fixing the wrong thing.
Ask what price has to clear next, then ask again
Put your cursor on the candle price is trading in right now. Look up and find the first high above it. That high is the next obstacle, so mark it and move on.
From there, ask the same question again. What is the next high above the one you just marked? Mark that one too. Keep going until you have three destinations above price, then run the same walk downward through the lows.
Say the stock trades at 100.00. The candle two bars back topped at 100.35, an older one at 100.80, and a third at 101.40. Those are your three, in that order. The 103 high that jumps out at you sits behind all of them, so it changes nothing today.
The rule that makes this work is the dull one. Do not skip candles. Every candle has a high and a low. Each one is a price where somebody already turned the tape.
Set the chart up so the walk is even possible
Three timeframes carry levels: the daily, the four hour and the one hour. The five minute chart is for timing an entry later. It prints new shapes constantly, and few of them still matter an hour later.
Switch the chart to regular session data before you start. Overnight candles trade thin and leave wicks that nobody defends the next day. Futures are the exception there, because the overnight tape is the tape.
Then zoom in. With a year of history on screen, every obstacle within a dollar of price is invisible. So you draw the far ones by default. Fill the screen with the last few sessions around current price instead.
Turn the indicators off while you draw. They hand you a reason to keep a line you could not otherwise justify. Bring them back afterwards if you want a second opinion on a thesis you already have.
Keep three above and three below, and merge the rest
Three supports and three resistances is the cap, counted across all three timeframes together. A single line, a merged zone and a gap box each count as one of the six. Past that, price is always near something, so every setup looks confirmed and nothing is filtered.
Levels sitting close together become one zone. On a large, high priced name the working merge distance is about a dollar. Scale it tighter for a cheap stock and wider for a fast one. Nobody has ever pinned that distance to a formula, and pretending otherwise would be dishonest. It is a judgement call tied to how far your instrument moves in an hour.
Once a zone exists, delete the lines inside it. Two levels fifteen cents apart cannot both be traded. Your entry and your stop end up on top of each other. Treat the zone as a place you do nothing until price is clearly above it or clearly below it.
The ten minute version you can run before the open
Run this before the session, then again on the hour if you are trading intraday. It gets quick once you stop hunting for the pretty levels.
- Clear yesterday's lines and start on a blank chart
- Set the chart to regular trading hours only
- Zoom in until the last few sessions fill the screen
- Draw the daily first, then the four hour, then the one hour
- Put your cursor on the current candle and look up
- Mark the first high above price, then the next high after that
- Run the same walk downward through the first lows
- Snap every line to the wick extreme so it cuts no candle
- Merge any two levels closer than your merge distance
- Delete every line left sitting inside a merged zone
- Stop at three zones above price and three below
- Write the six prices in your journal before the bell
Frequently asked questions
Start at the current candle and mark the first high above price and the first low below it. Repeat outward until you hold three each way. Snap every line to the wick extreme.
Work from current price backwards instead. Left to right makes you draw the oldest, most obvious extremes first. Price has to clear everything in between before it gets there.
Three above price and three below, counted across the daily, four hour and one hour together. A merged zone or a gap box counts as one. Beyond six the lines stop filtering anything.
Redraw the level on TraderLog's replay chart
Every imported trade in TraderLog opens on a TradingView chart with your entry and exit marked. Redraw the level candle by candle and see what your first line missed. The day's journal entry is where the answer goes.
Every trading morning at 8:40 ET our model draws the SPY, QQQ and IWM zones it expects to matter, on a TradingView chart, before the open. Where price reaches one, it has turned 74 percent of the time. Free, no account. See today's map